SilotechSILOTECHSIMPLE · LOVABLE · TECH-DRIVEN

Case Studies

In-depth case studies from the Silotech team.

Case Study · Green Tech

B2MS — Battery Monitoring & Management System

Know the health of every battery, everywhere — in real time.
Click the image to view it full-screen — scroll to zoom

Overview

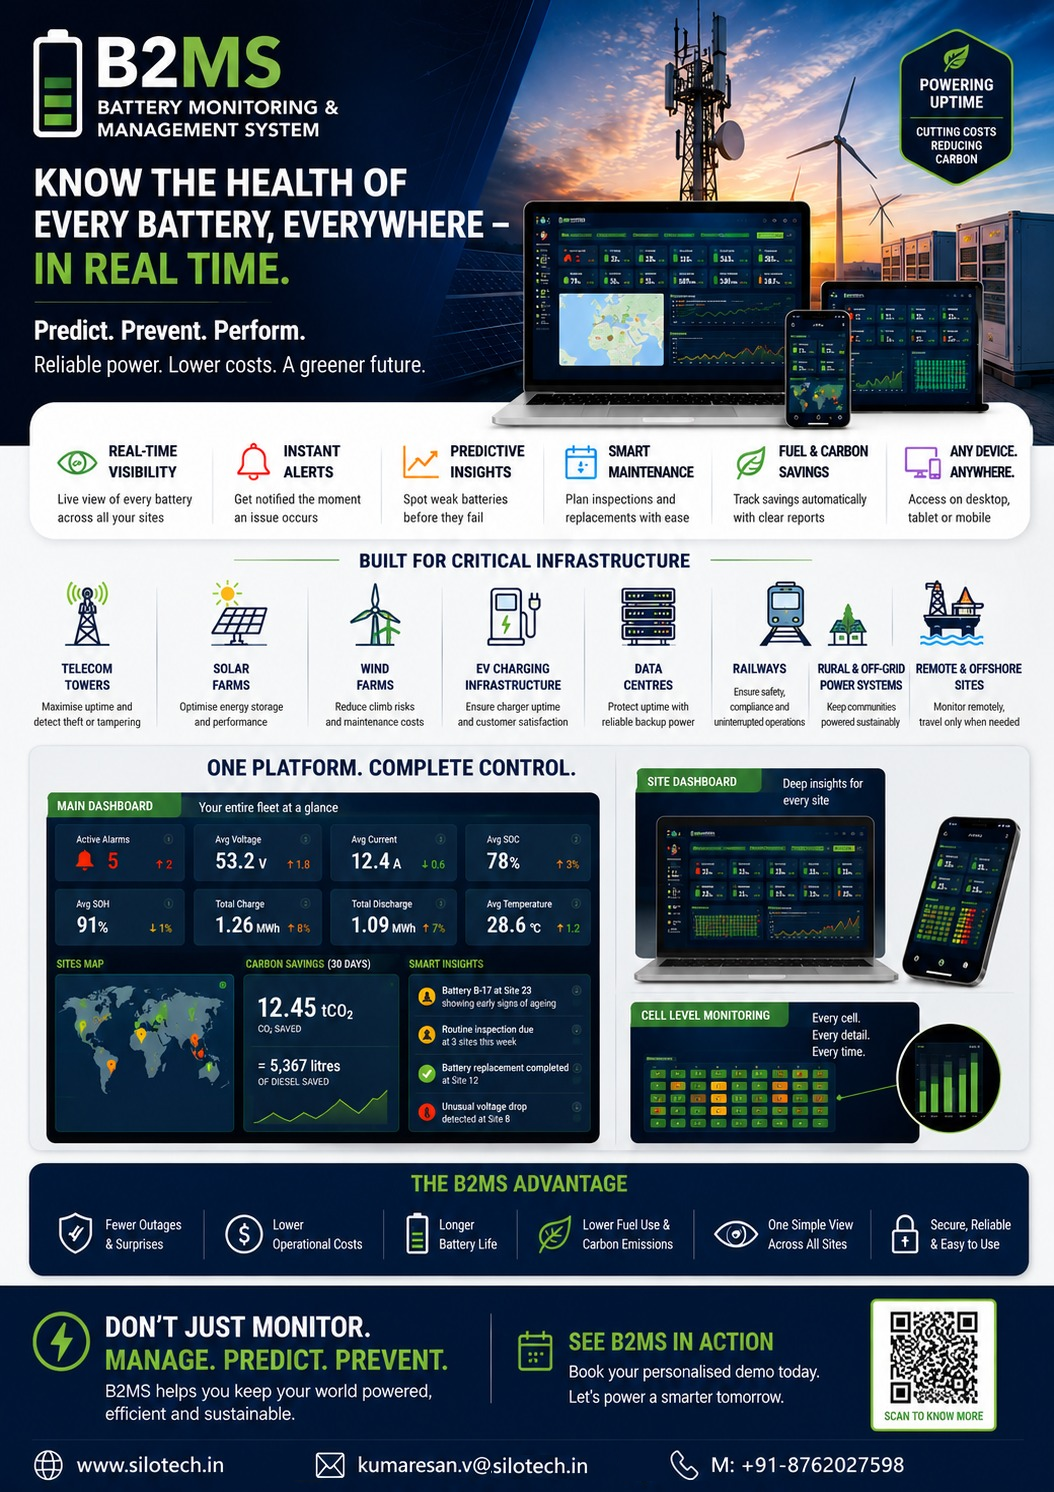
B2MS keeps an eye on the batteries that keep your sites running — at cell towers, solar and wind farms, and other remote locations. It shows how healthy each battery is, in real time, on any screen. The moment something looks wrong, it warns you straight away, so you can fix small problems before they turn into a power cut.

The Problem We Solve

Batteries at far-away sites are out of sight — until one fails. By then the damage is usually a power outage, an emergency visit, or an expensive replacement. B2MS gives teams a simple, live picture of how every battery is doing across all of their locations.

What B2MS Does for You

  • See all of your sites and their batteries live, from one place.

  • Get an instant alert the moment a battery has a problem.

  • Spot weak batteries early — before they let you down.

  • See how much fuel and carbon you are saving.

  • Arrange the screens and alerts your way — no software changes needed.

  • Use it on a computer, tablet or phone.

Predict Problems Before They Happen

B2MS does more than tell you when a battery has failed — it helps you see trouble coming, so your team can plan ahead instead of rushing to an emergency call-out.

  • Early warning — ageing or weakening batteries are flagged well before they fail.

  • Replace on condition, not guesswork — change a battery only when it truly needs it.

  • Fewer surprise outages — small issues are caught and fixed while they are still small.

Plan and Track Maintenance

  • Schedule inspections and replacements, with reminders and a built-in calendar.

  • Keep a complete history for every battery and site — checks, notes, photos and documents in one place.

  • Hand over smoothly — when staff change, the full record stays with the site.

The Benefits

  • Fewer outages and fewer unpleasant surprises.

  • Fewer and shorter site visits — and lower costs.

  • Longer battery life — replace a battery only when you really need to.

  • Lower fuel bills and a clear sustainability story.

  • One simple view for your whole fleet of sites.

  • Safe, secure and easy for anyone to use.

Other Handy Features

  • Health at a glance — every battery green for healthy, amber for caution and red for urgent.

  • Instant alerts by site, so the right team responds quickly.

  • Simple reports you can view, share or download.

  • Fuel and carbon savings tracked automatically.

  • A map of all your sites in one view.

  • Your own dashboard — arrange the screens and numbers you care about most.

Where B2MS Helps

  • Telecom / Cell Towers — watches backup batteries at every tower at once and warns the instant one weakens; cuts diesel run-time and flags drops that can signal theft or tampering.

  • Solar Farms — shows the health and charge of every battery, highlights under-performing batteries early, and tracks the carbon you save.

  • Wind Farms — keeps a constant eye on each turbine's hard-to-reach batteries from the ground and lets you plan a single, well-timed maintenance trip.

  • EV Charging — monitors the storage that keeps chargers available and warns you before a battery problem can take chargers offline.

  • Data Centres — watches every backup battery, gives early warning on the ones weakening, and helps you replace them on a planned schedule.

  • Rural & Off-grid — a clear, live view of every remote site, flagging batteries that need attention while reducing generator run-time and emissions.

  • Railways — continuously monitors trackside power, alerts the right team instantly, and keeps a clear record for safety audits.

  • Remote & Offshore — brings the condition of every battery to your screen, so you travel to hard-to-reach sites only when there is a genuine reason.

A Greener Bottom Line

Every time a battery carries the load instead of a diesel generator, you save fuel and cut carbon. B2MS adds this up for you in plain numbers — for today and for the month.

What You Will See On Screen

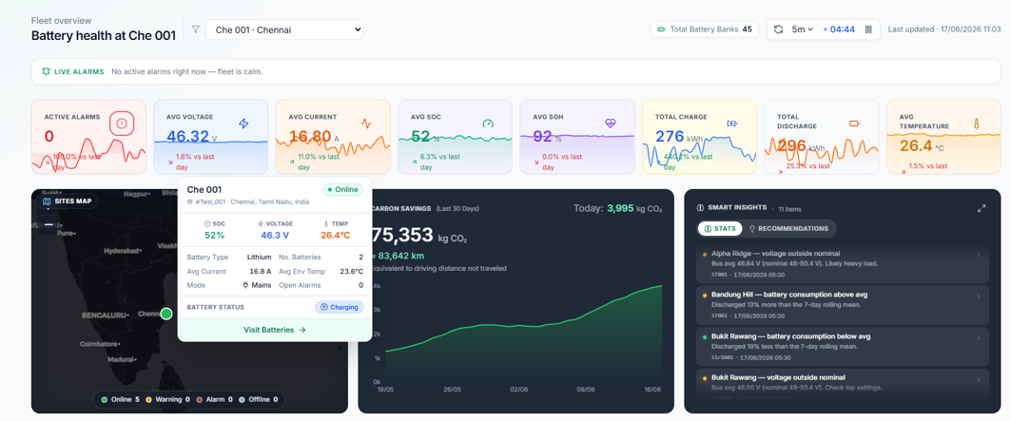
Main Dashboard — your whole fleet at a glance
Main dashboard
  • Live Alarms banner and eight fleet vital-sign cards (Active Alarms, Avg Voltage, Avg Current, Avg SOC, Avg SOH, Total Charge, Total Discharge, Avg Temperature).

  • Sites map colour-coded by status, plus carbon savings and a smart-insights feed.

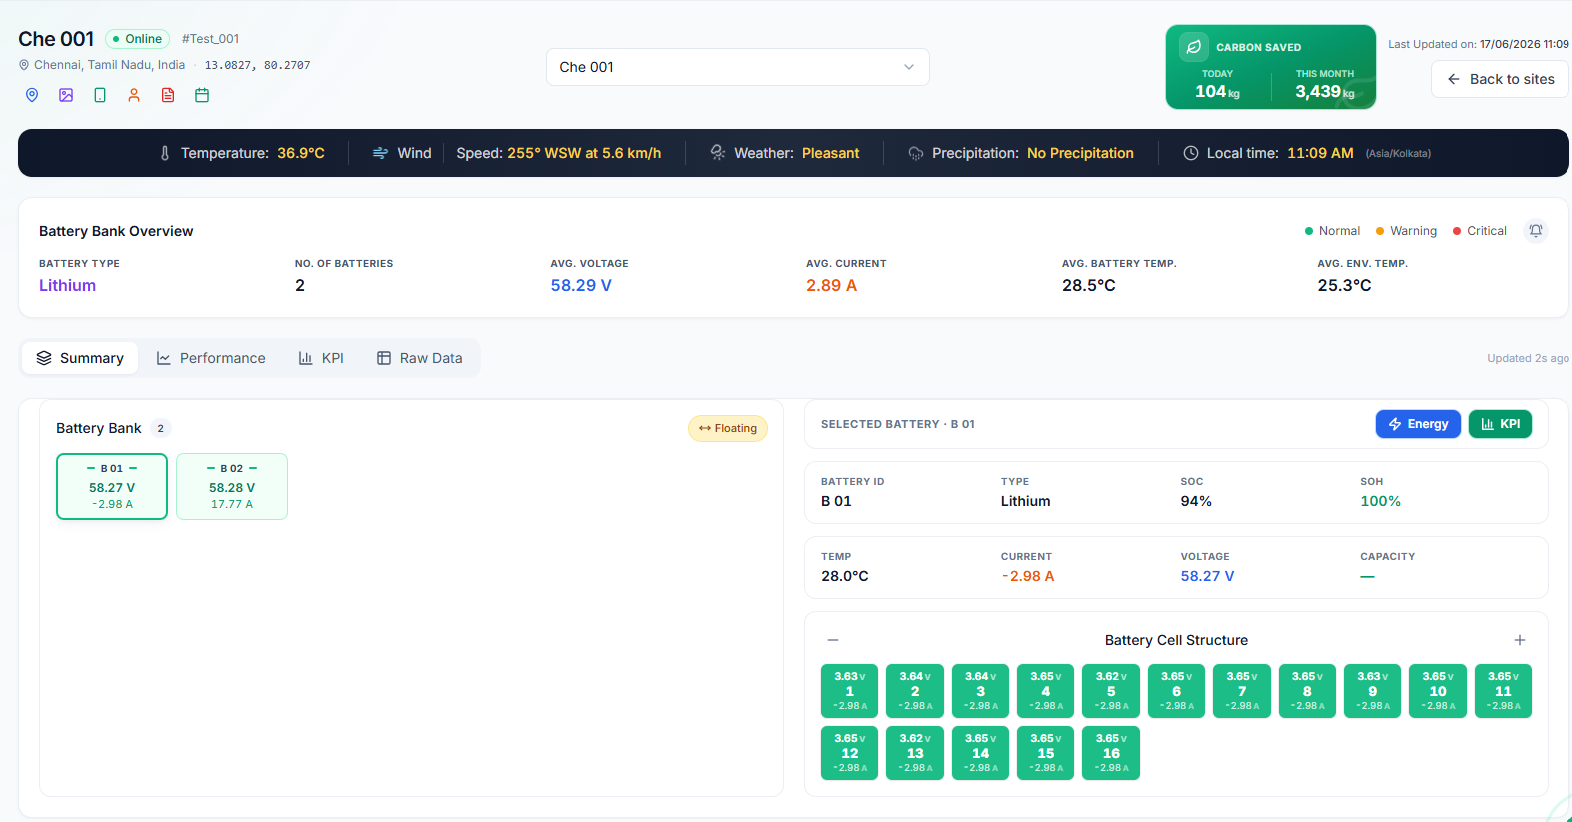
Site Dashboard — a closer look at one site
Site dashboard
  • Battery-bank overview, per-battery tiles colour-coded by health, and the selected battery's SOC/SOH/temperature.

  • Battery cell structure and this site's carbon saved.

Cell Voltage Details
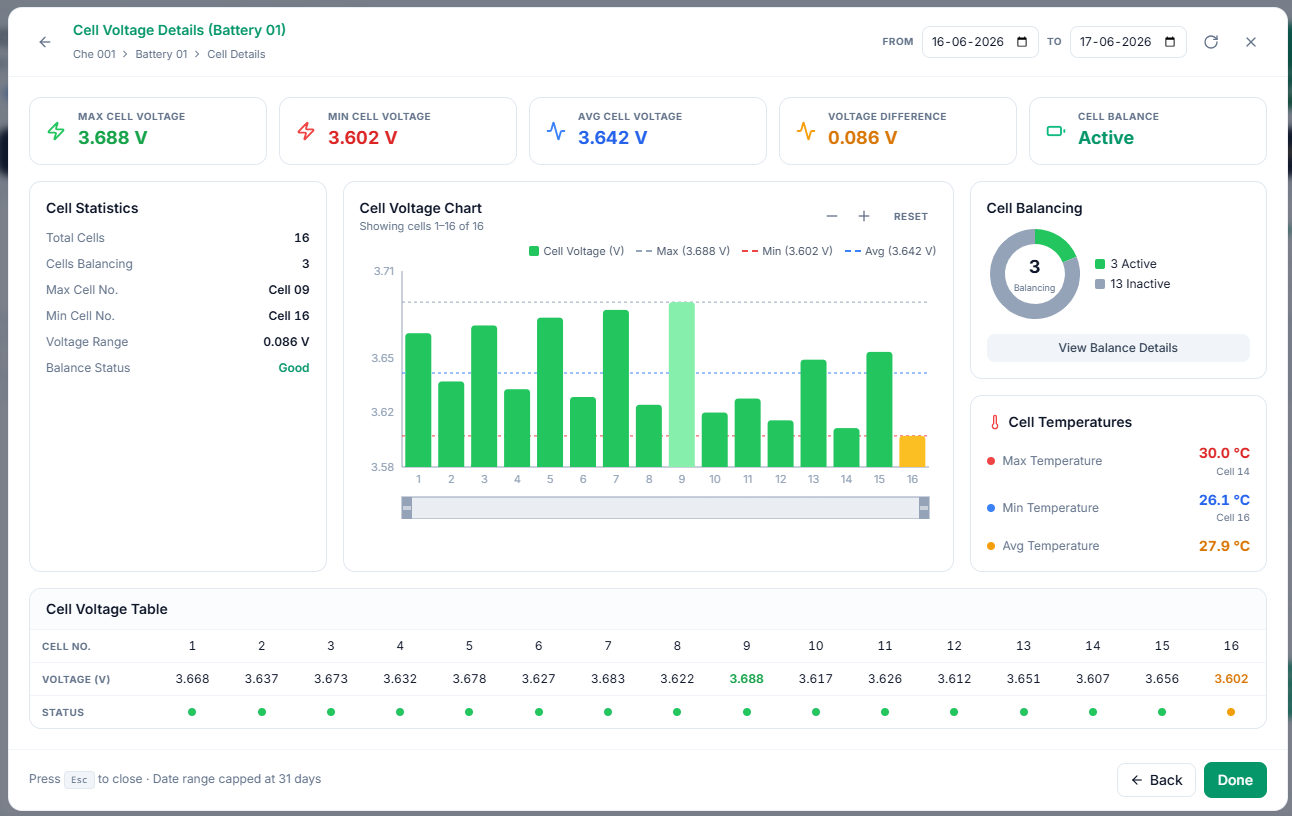
Cell voltage

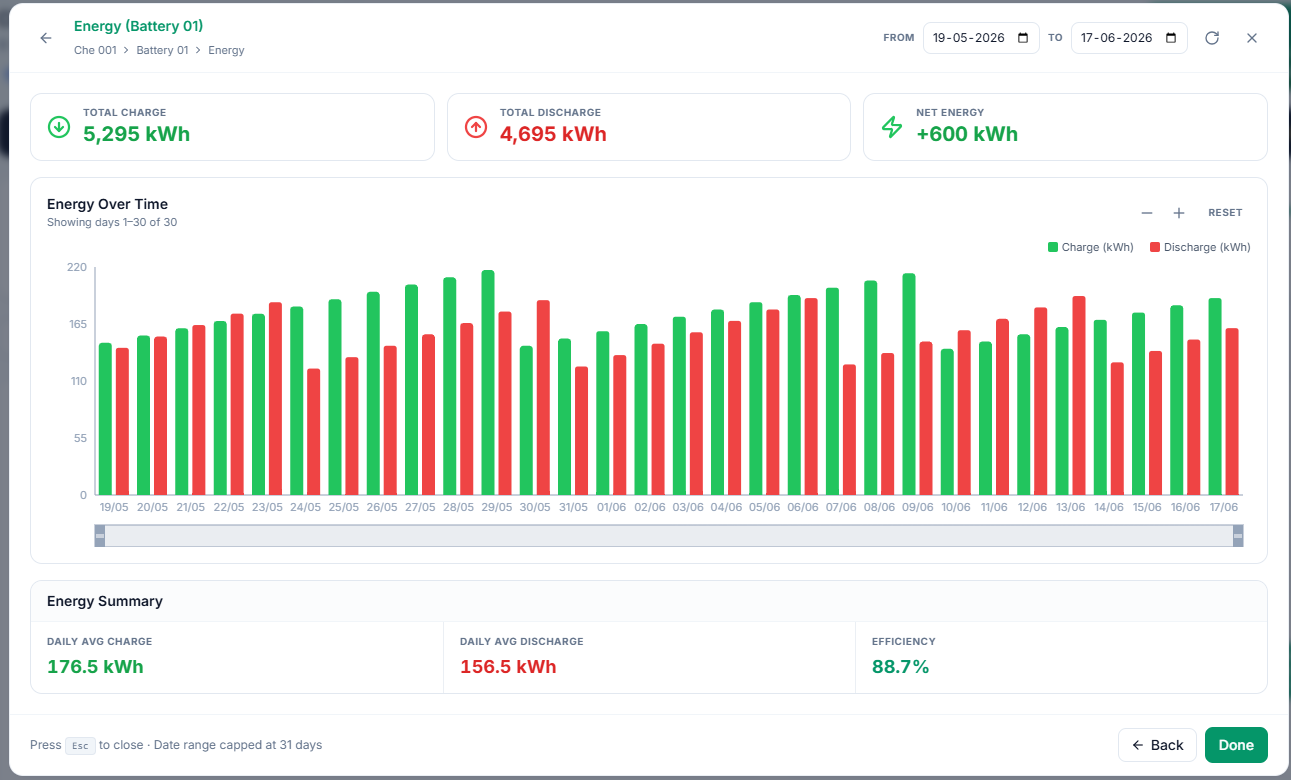
Energy — charge in, energy out

Energy

Why B2MS

The batteries that keep your sites running are too important to leave unseen. B2MS gives you a single, clear view of the health of every battery you depend on — and warns you in time to act. Fewer outages, lower costs, longer-lasting batteries, and a real, measurable cut in fuel and carbon — all from one simple, secure platform.
Case Study · Green Tech

EnvAiroMetrics — Elevating Smart Facility Management

Turning chaotic IoT data into clean, timely, actionable facility intelligence.

Click the image to view it full-screen — scroll to zoom

Overview

EnvAiroMetrics is an advanced environmental telemetry and data orchestration platform for modern smart facility management. It is the intelligent bridge between raw IoT sensor data and actionable enterprise intelligence — gathering, processing and delivering insights on indoor air quality and facility occupancy.

The Challenges in Facility Management

  • Data Overload & Inaccuracy — raw IoT data leads to duplicate reporting, confusing dashboards and alert fatigue.
  • Delayed Insights — stagnant reports prevent real-time responses to degrading air quality or foot-traffic surges.
  • Rigid & Fragmented Systems — hard to adopt new sensors or integrate with third-party platforms without costly updates.
  • Maintaining Healthy Spaces — without reliable tracking it is hard to guarantee a safe, comfortable, productive environment.

What EnvAiroMetrics Will Do

It continuously monitors your IoT sensors and instantly processes the raw information into clean, reliable summaries — delivering perfectly timed, accurate insights about air quality and occupancy, and routing critical alerts immediately when conditions deteriorate.

Visualizing the Data

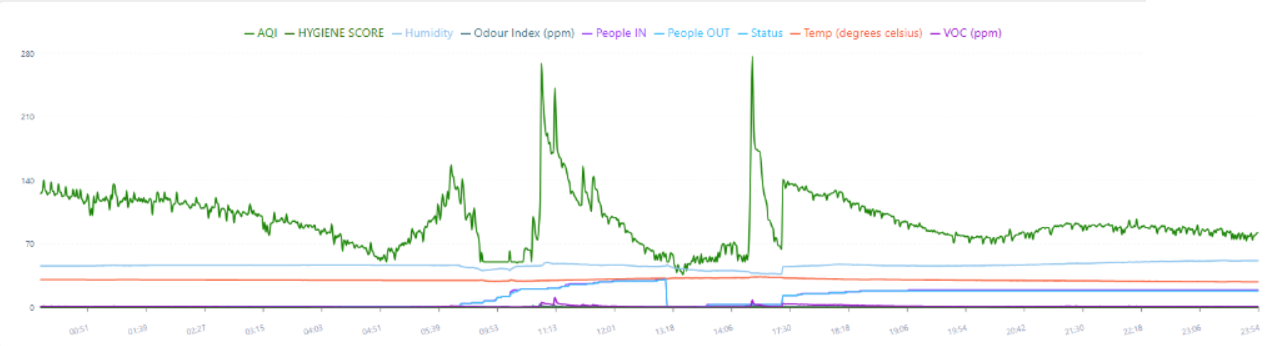
Comprehensive Telemetry Charting

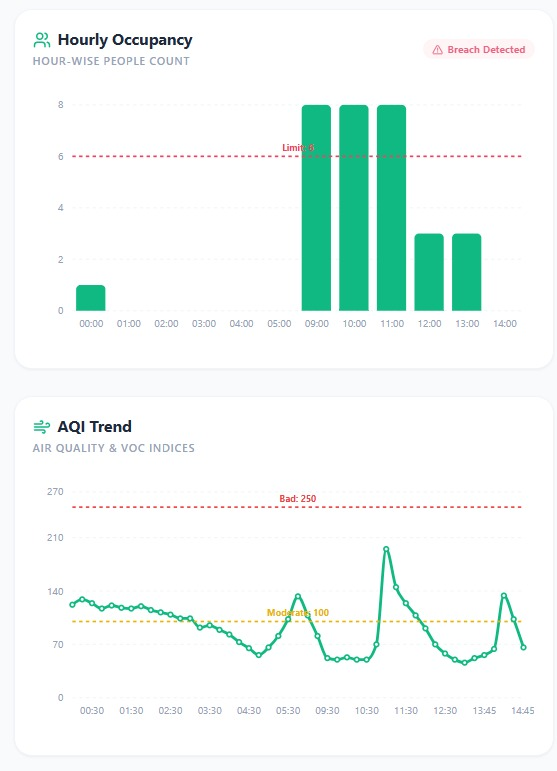
A single, cohesive timeline aggregates AQI, Hygiene Score, Humidity, Odour Index, People IN/OUT, Temperature and VOC, so managers can spot correlations at a glance.

Combined telemetry chart

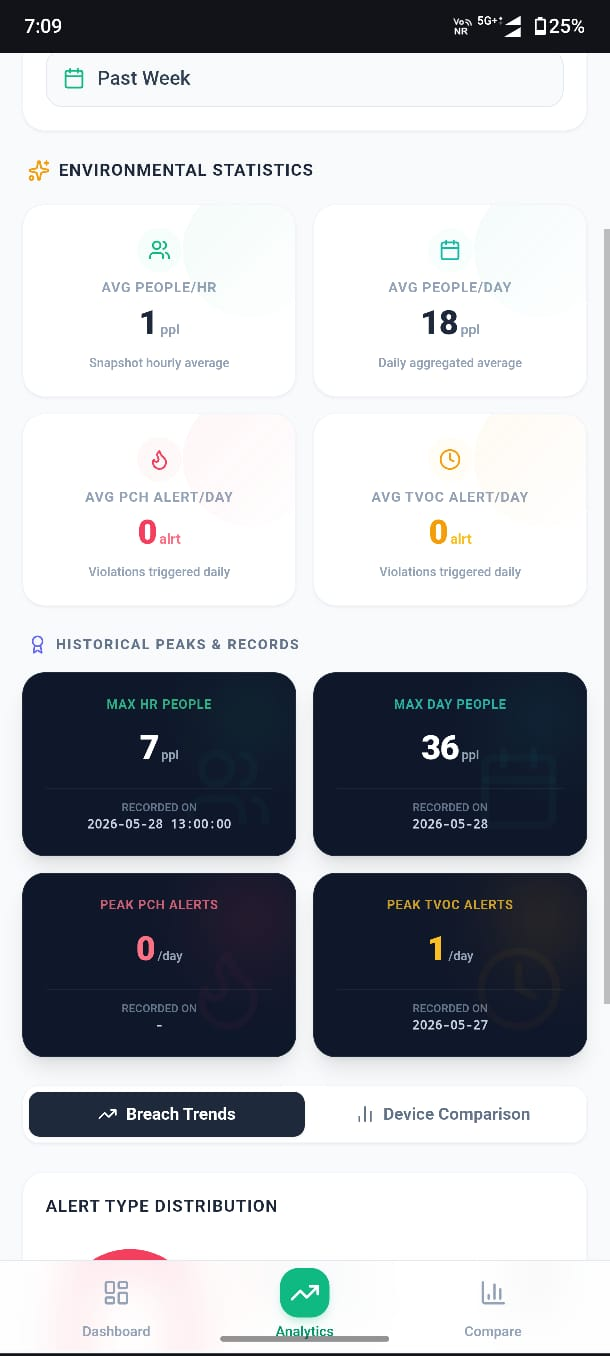
Environmental Statistics & Mobile View

Mobile environmental statistics
  • Occupancy metrics — average people per hour and maximum daily peaks.
  • Alert history — people-count and air-quality alerts triggered through the day.
  • Visual breach tracking and AQI trends against Moderate/Bad thresholds.
Hourly occupancy and AQI trend

Proactive Supervisor Alerts

If a threshold is breached — poor air quality, high odour index, or overcrowding — the designated supervisor gets an immediate alert and can dispatch a team to make the environment clean, comfortable and safe again.

The Benefits

  • Improved occupant health & safety — proactively maintain high indoor air-quality standards.
  • Operational efficiency — teams see only accurate, deduplicated insights, reducing false alarms.
  • Future-proof adaptability — update reporting formats dynamically without downtime.
  • Reduced IT overhead — self-cleaning routines and automated error-recovery.

Key Features

  • Precision reporting schedules for predictable dashboards.
  • Intelligent alerts that auto-resolve when conditions normalise.
  • Dynamic, template-driven data formatting for external systems.
  • Robust delivery guarantee — queues and retries until successful.

How It Will Help

  • Optimise HVAC & energy usage from real-time occupancy and air-quality trends.
  • Ensure compliance & safety with a verifiable history of indoor conditions.
  • Enhance the tenant experience with responsive facilities.
  • Streamline operations with a reliable, hands-off data pipeline.

Executive Summary

EnvAiroMetrics turns chaotic IoT data into clean, timely and actionable insights — enabling organisations to safeguard occupant health, optimise efficiency, and adapt to future demands without the burden of ongoing IT maintenance.

Case Study · Green Tech

RaMS — Real Time Telecom Asset Management System

Every tower, every asset, one live picture — act before it fails.

Click the image to view it full-screen — scroll to zoom

Overview

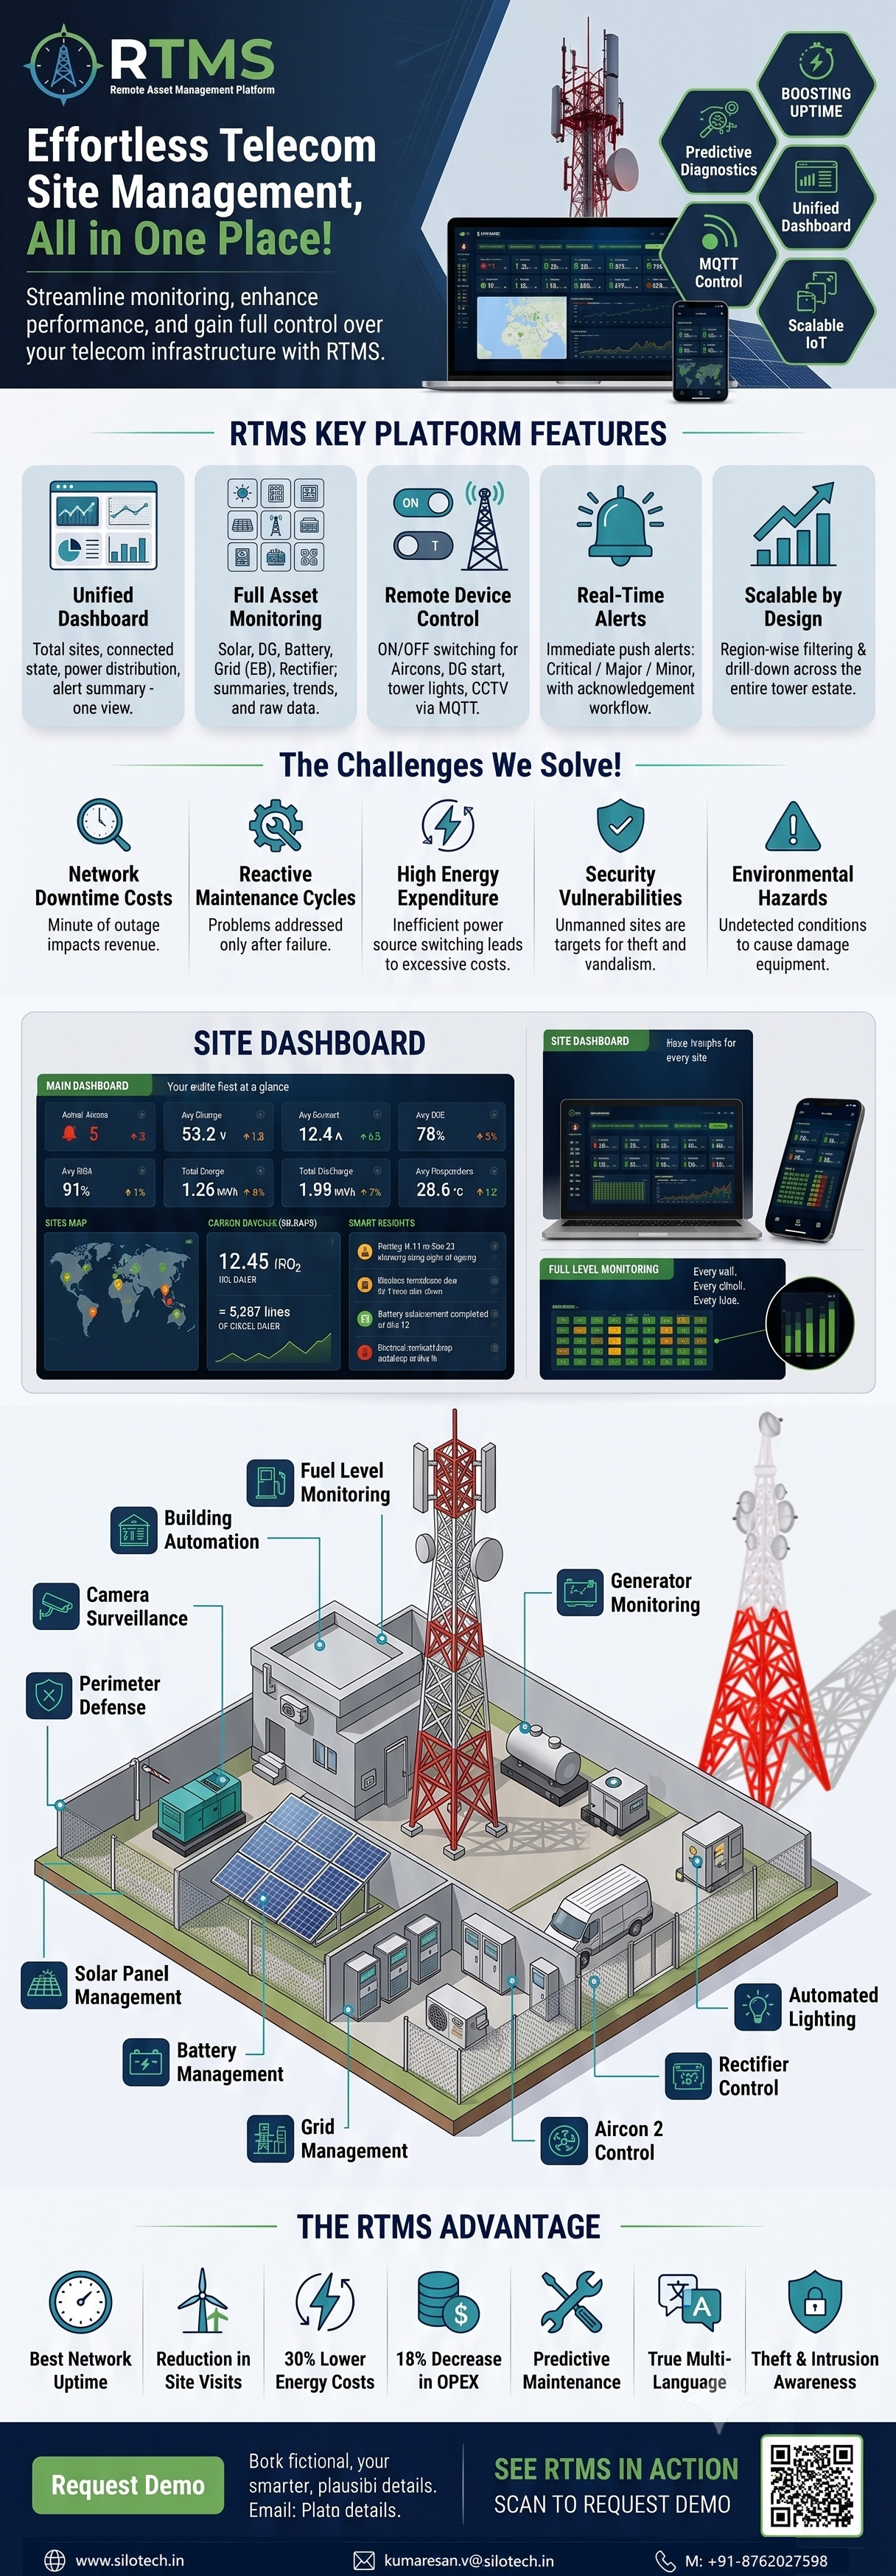
RaMS watches over everything that keeps a telecom site alive — the grid supply, batteries, diesel generators, solar, rectifiers, sensors and site devices — across all of your towers, in real time, on any screen. Controllers at each site stream readings every few minutes and push alarms the instant something goes wrong, so your team sees trouble the moment it starts and can act before a site goes dark.

The Problem We Solve

A telecom network is only as strong as its weakest site. Power assets at remote towers — batteries, generators, rectifiers, solar — fail quietly, and the first sign is usually a site outage, an emergency truck-roll, or an angry escalation. Field teams waste trips checking healthy sites while a weak one slips through. RaMS replaces guesswork with one simple, live view of every asset at every site.

What RaMS Does for You

  • See all of your sites and every power asset live, from one place.
  • Get an instant alert the moment anything goes wrong — graded Critical, Major or Minor.
  • Drill from the network view to a single site, a single asset, even a single battery cell.
  • Switch loads remotely — aircon and DG on/off from your desk, over MQTT.
  • Watch site security too — door, smoke, flood, motion sensors and site cameras.
  • See how much diesel and carbon every site is saving, today and this month.
  • Arrange the screens your way — build your own dashboards and widgets, no software changes needed.
  • Work in your language — English, Malay, Indonesian, Filipino, Chinese, Tamil, Arabic, and any language your admin adds.
  • Use it on a computer, tablet or phone — light, dark or glassy theme.

Predict Problems Before They Happen

RaMS does more than report failures — it helps you see them coming.

  • Early warning — weakening batteries, falling solar yield, rising rectifier load and abnormal grid behaviour are flagged before they cause an outage.
  • Replace on condition, not guesswork — SOC, SOH, imbalance and efficiency trends tell you when an asset truly needs attention.
  • Fewer surprise outages — voltage and current trends, phase imbalance and fuel levels are tracked continuously so small issues stay small.

Plan and Track Maintenance

  • A built-in calendar for inspections, service visits and replacements — with alarm history alongside.
  • A complete record for every site — photos, documents, in-charge contacts, controllers and SIM cards, battery bank and cell layout, DG and solar details.
  • Next-service dates on every sensor and device, so nothing is forgotten.
  • Hand over smoothly — when staff change, the full site record stays with the site.

The Benefits

  • Fewer outages and fewer unpleasant surprises across the network.
  • Fewer and shorter site visits — and lower operating costs.
  • Longer asset life — batteries, generators and rectifiers serviced when they need it, not before.
  • Lower diesel bills and a clear, measurable sustainability story.
  • One simple view for the whole network — and one click down to any detail.
  • Safe, secure and easy for anyone to use, with role-based access.

Other Handy Features

  • Health at a glance — every site and asset colour-coded: green healthy, amber caution, red urgent.
  • Instant alerts by site and by asset, so the right team responds quickly.
  • Every table searchable, filterable and exportable to CSV — raw 5-minute data included.
  • Fuel and carbon savings tracked automatically, per site and network-wide.
  • A live map of all your sites, colour-coded by status, with one-click site drill-down.
  • Your own dashboards — drag, drop and resize the widgets you care about, or design new ones.
  • Multi-tenant sites supported — see each tenant's assets separately on the same tower.
  • Weather at the site — temperature, wind, precipitation and local time beside the live readings.

Where RaMS Helps

  • Mobile Operators (MNOs) — network-wide visibility of every BTS site's power chain, from grid input to battery cell, with alarms routed to the right regional team.
  • Tower Companies (TowerCos) — manage thousands of shared sites and their tenants from one screen, with a complete asset and maintenance record per tower for SLA reporting.
  • Managed Service Providers — run O&M for multiple customers with clear per-site histories, planned visits instead of emergency call-outs, and exportable proof of work.
  • Rural & Off-grid Sites — solar-DG-battery hybrid sites kept in balance remotely; cut generator run-time and travel only when there is a genuine reason.
  • In-Building & BTS Hotels — indoor sites and shared hotels monitored alongside outdoor towers, with the same drill-down detail.
  • Border & Remote Regions — sensors, cameras and door alarms flag theft or tampering at unmanned sites the moment it happens.

A Greener Bottom Line

Every hour a site runs on grid, solar or battery instead of a diesel generator, you save fuel and cut carbon. RaMS adds this up for you in plain numbers — for each site and for the whole network, for today and for the month — right on the dashboard.

What You Will See On Screen

Main Dashboard — your whole network at a glance

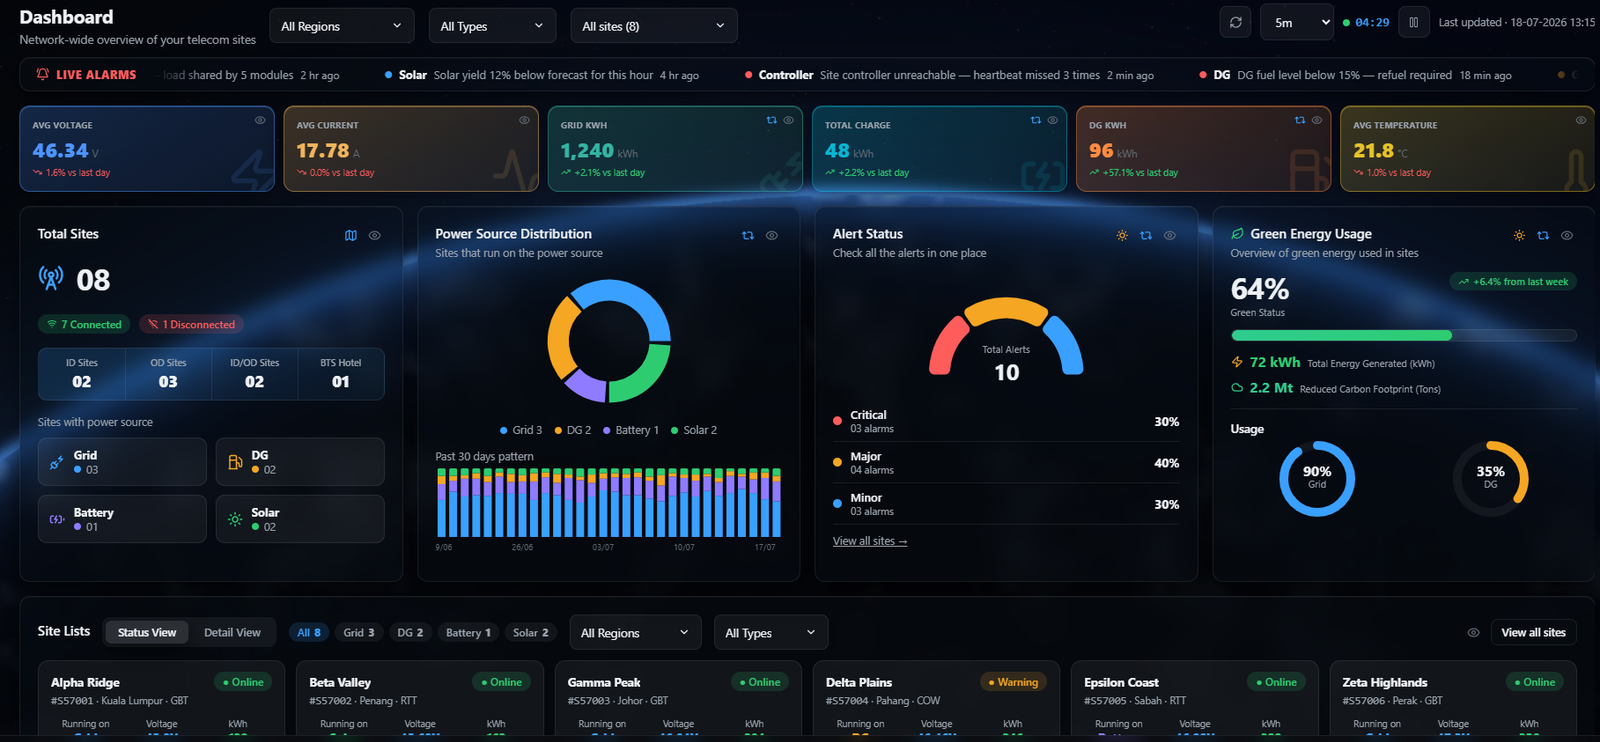
RaMS main dashboard
  • Live Alarms banner and vital-sign cards — Avg Voltage, Avg Current, Grid kWh, Run Hours, Charge, Discharge, DG kWh and Temperature.
  • Total Sites with a live colour-coded map, Power Source Distribution, Alert Status gauge and Green Energy usage — each card flips to deeper detail.
  • Site Lists in card or table view, filterable by region, site type and power source.

Site Dashboard — a closer look at one site

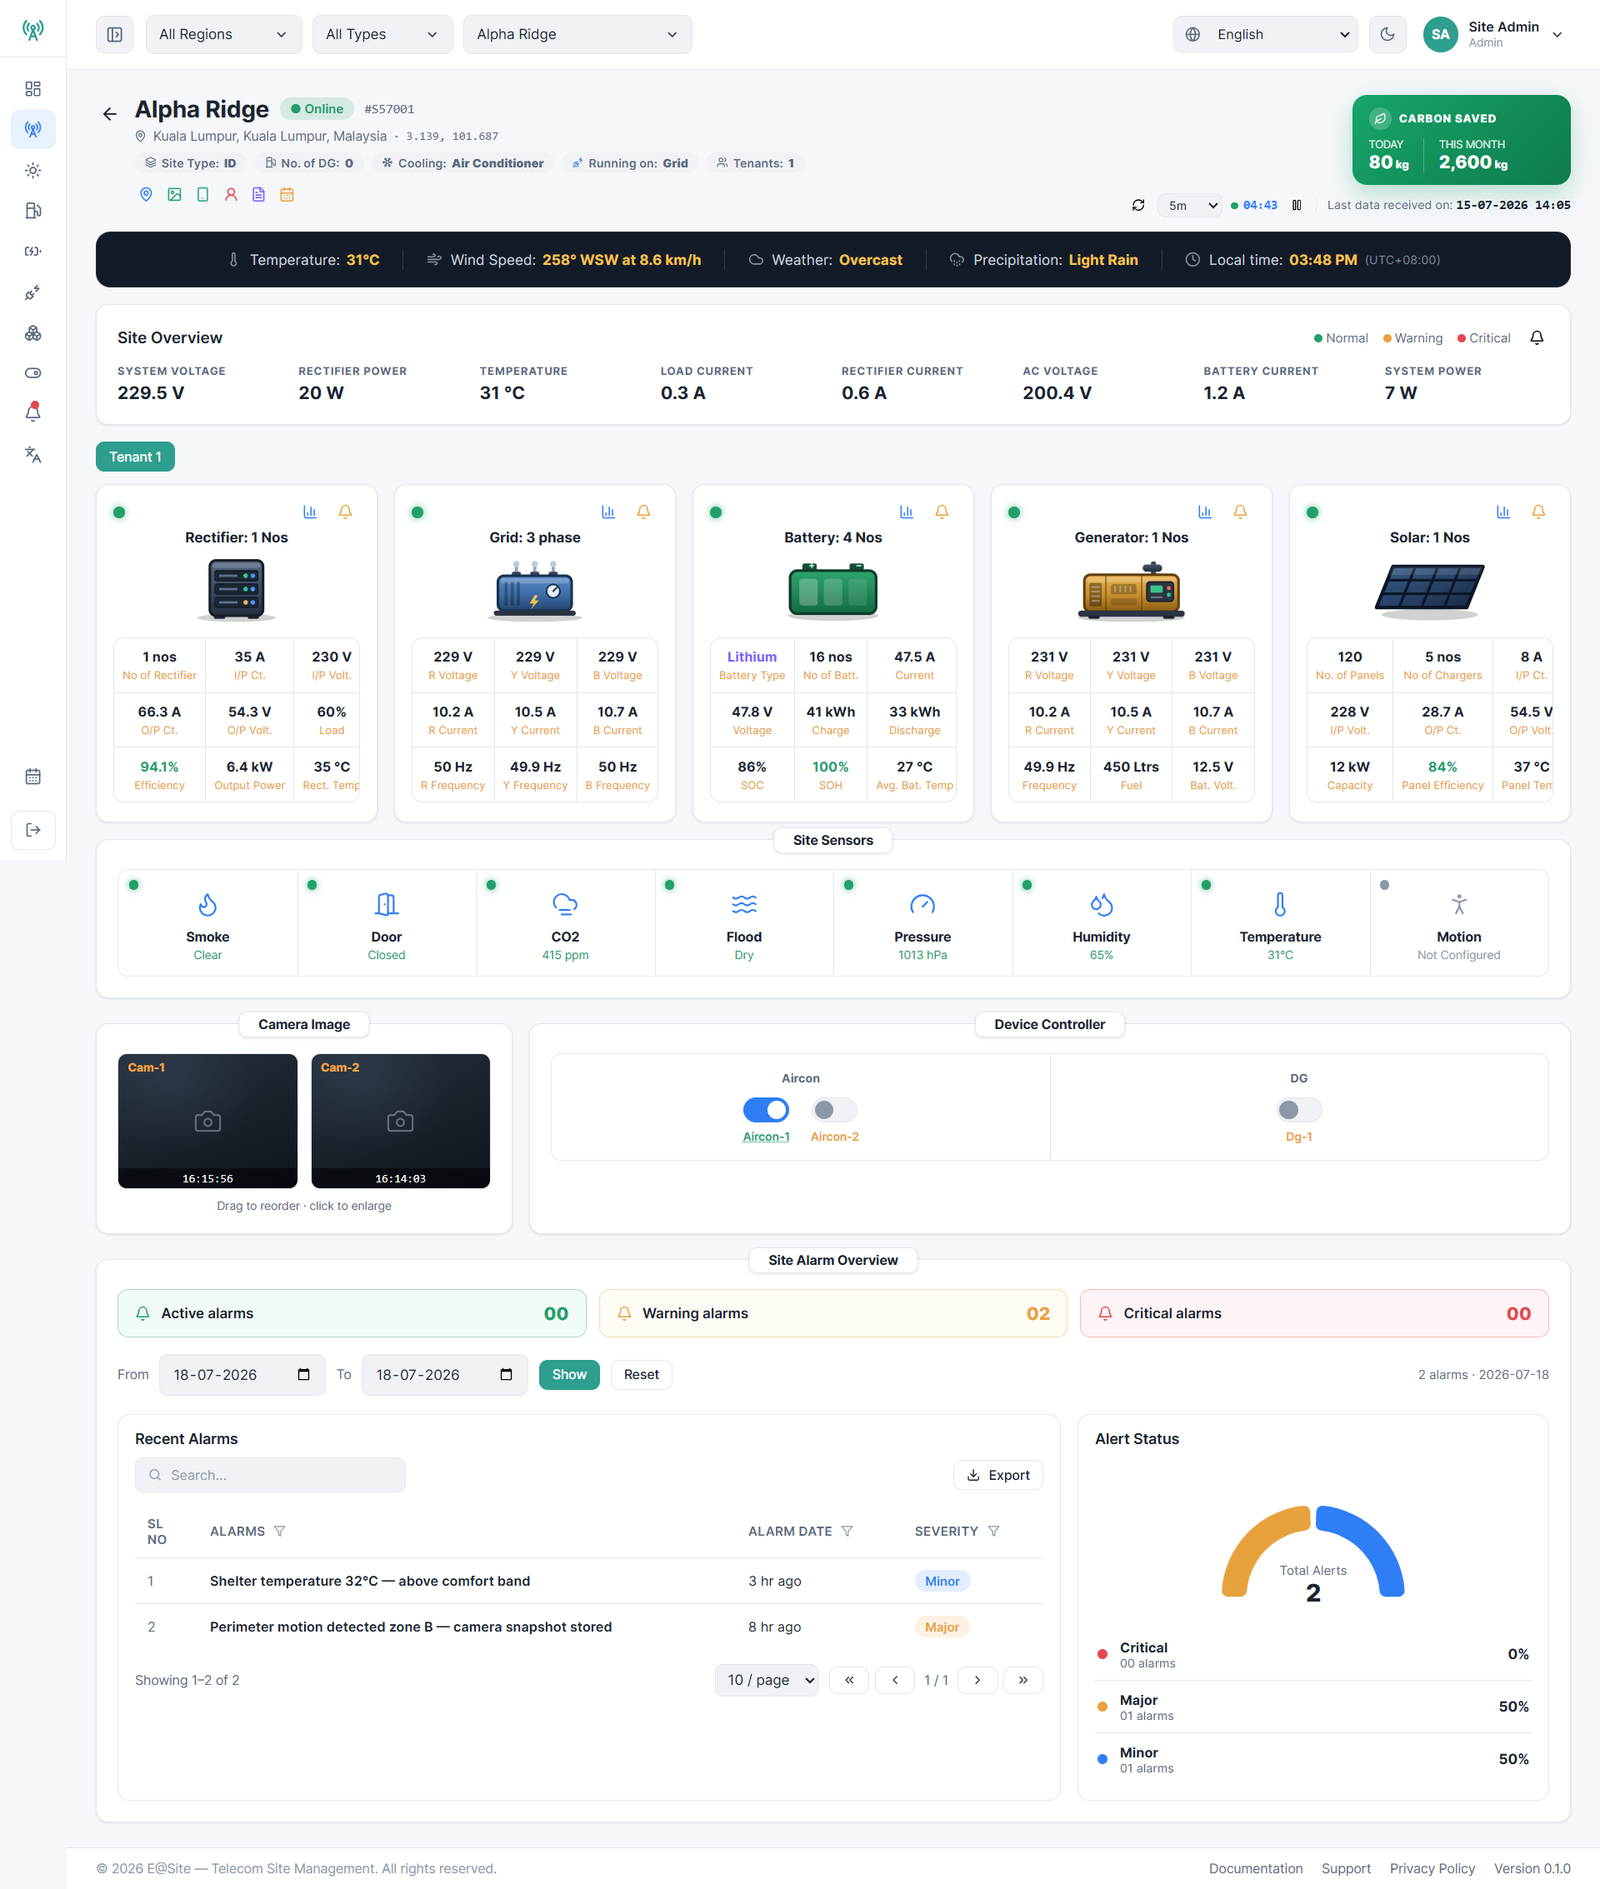
RaMS site dashboard
  • Site identity, location, cooling, tenants and live weather at the site.
  • Site Overview strip — system voltage, load, rectifier and battery readings at a glance.
  • Asset cards for Rectifier, Grid, Battery, Generator and Solar — each with live values and one-click drill-down to Summary, Performance, KPI and Raw Data.
  • Site sensors, camera views and remote device control (aircon, DG).
  • This site's carbon saved — today and this month — and its alarm overview.

Asset Detail — Summary, Performance, KPI, Raw Data

RaMS asset detail
  • Grid: phase imbalance gauges, power factor, consumption and usage trends.
  • Battery: bank tiles, per-battery SOC/SOH, cell structure and energy in/out.
  • Generator: fuel consumption, efficiency, run hours and power trends.
  • Solar: panel parameters, efficiency, utilisation and production.
  • Rectifier: module status, load, efficiency and input/output trends.

Site Management — add and edit sites with map location, battery bank designer, photos, documents, in-charge contacts, controllers and SIM cards.

Why RaMS

The assets that keep your network on air are too important to leave unseen. RaMS gives you a single, clear, real-time view of every site and every asset you depend on — and warns you in time to act. Fewer outages, lower costs, longer-lasting assets, and a real, measurable cut in diesel and carbon — all from one simple, secure platform.
Case Study · Green Tech

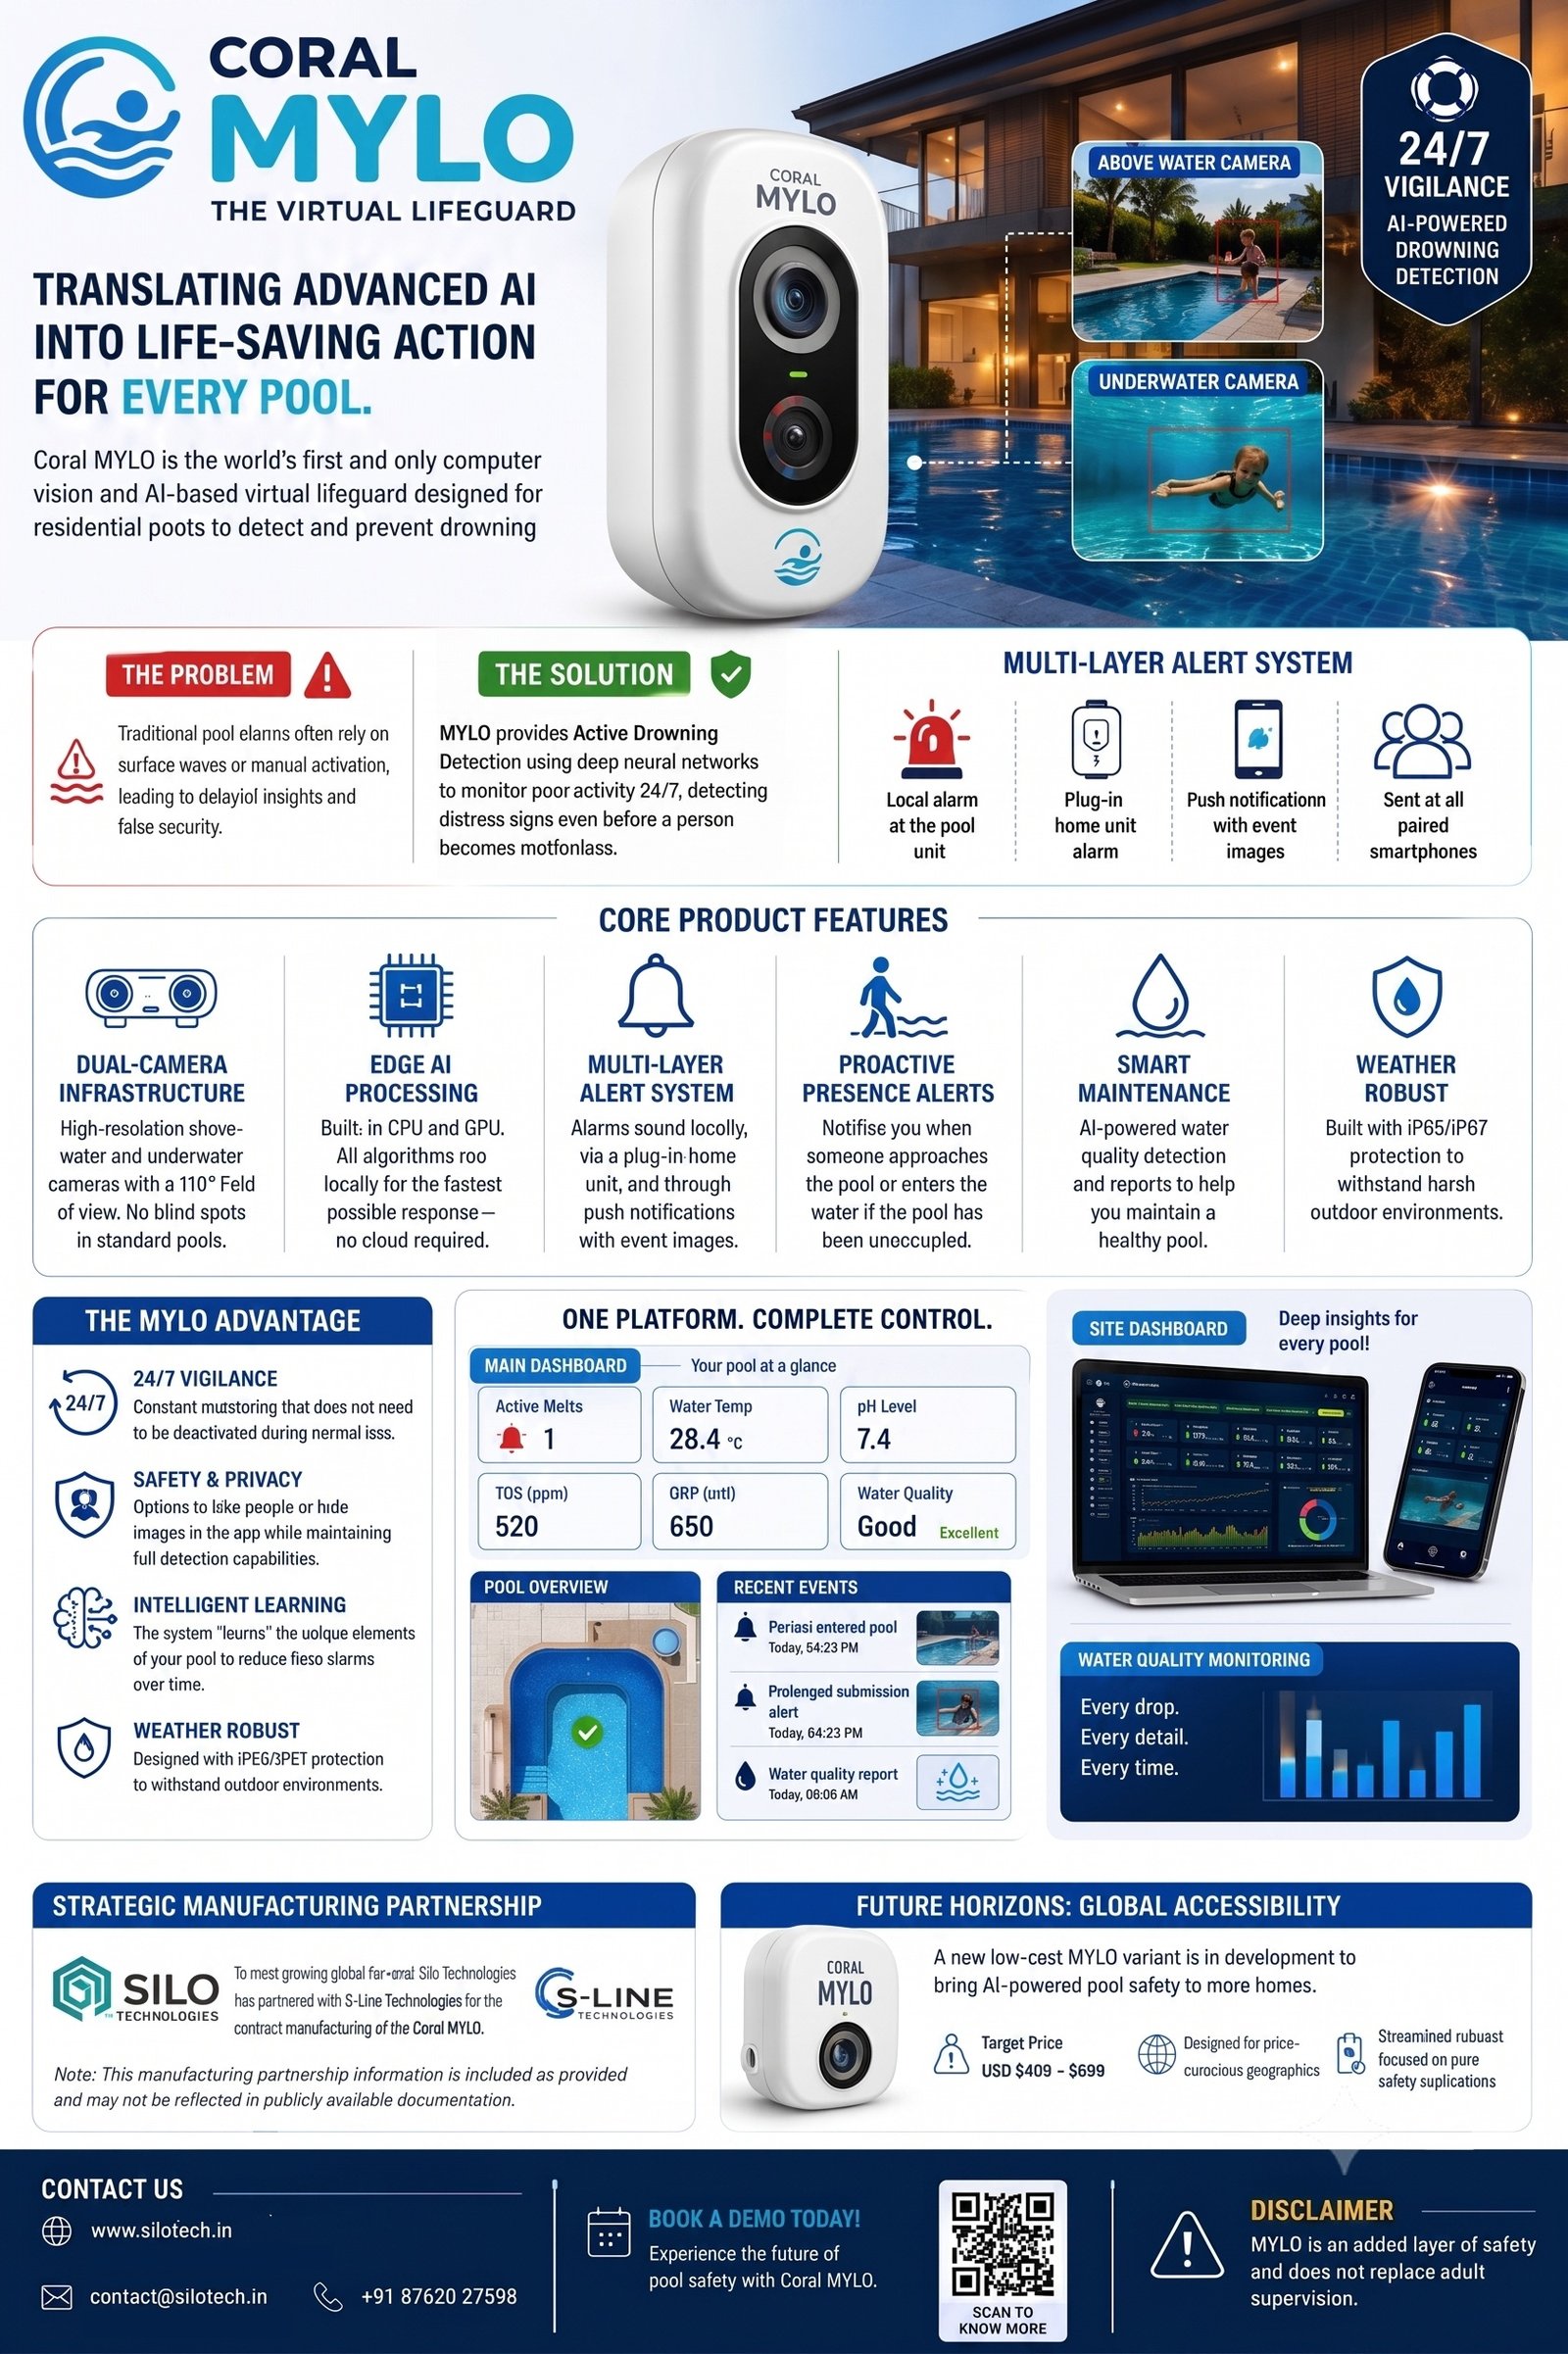
Coral MYLO — Intelligent Pool Safety & Monitoring

Real-time pool safety and water-health monitoring — warns you in time to act.

Click the image to view it full-screen — scroll to zoom

Overview

Coral MYLO keeps a constant eye on the residential pools that keep your spaces secure — at private homes, community complexes, and luxury villas. It shows how safe and healthy each pool is, in real time, on any screen. The moment something looks wrong, it warns you straight away, so you can prevent critical accidents or drowning before a person becomes motionless.

The Problem We Solve

Pools are out of sight when you are indoors — until an accident happens. Traditional systems rely on manual activation or delayed wave alerts, which usually means delayed insights, false security, or emergency situations. Coral MYLO gives teams and families a simple, live picture of how every pool is doing across all of their properties.

What Coral MYLO Does for You

  • See all of your properties and their pools live, from one place.
  • Get an instant alert the moment a distress sign or water quality issue occurs.
  • Spot weak water chemistry or unexpected visitors early — before they cause problems.
  • See how much monitoring time and water treatment costs you are saving.
  • Arrange the screens and alerts your way — no software changes needed.
  • Use it on a computer, tablet, or smartphone.

Predict Problems Before They Happen

Coral MYLO does more than tell you after a submersion has happened — it helps you see trouble coming (like a person approaching an empty pool area), so you can act immediately instead of reacting to a tragic emergency.

  • Early warning — proactive presence alerts flag entry well before a person gets into deep distress.
  • Maintain on condition, not guesswork — adjust pool chemicals and filtration only when the metrics truly demand it.
  • Fewer surprise hazards — small water balance anomalies or perimeter breaches are caught and fixed while they are still small.

Plan and Track Maintenance

  • Schedule water testing, cleaning cycles, and filtration checks with reminders and a built-in logs calendar.
  • Keep a complete history for every pool and location — checks, notes, photos, and automated water quality metrics in one place.
  • Hand over smoothly — when safety staff or property managers change, the full historical record stays with the site.

The Benefits

  • Fewer close calls and fewer unpleasant surprises around water areas.
  • Fewer unnecessary manual checking trips — and lower ongoing chemical costs.
  • Longer lifespan for pool equipment — backwash and service filters only when you really need to.
  • Lower utility bills and a clear, data-driven eco-sustainability story.
  • One simple view for your whole portfolio of properties and pools.
  • Safe, secure, and easy for any homeowner or site manager to use.

Other Handy Features

  • Health at a glance — pool status color-coded green for healthy/safe, amber for caution, and red for urgent alarms.
  • Instant alerts by site zone — push notifications route directly so the closest guardian responds quickly.
  • Simple reports — dynamic health dashboards you can view, share, or download instantly.
  • Privacy masking — built-in smart filters protect individual privacy while maintaining full detection capabilities.
  • A map of all your pools — clear visual pins of all properties mapped into one cohesive panel.
  • Your own dashboard — arrange the live cameras, pH numbers, and temperature values you care about most.

Where Coral MYLO Helps

  • Residential Homes / Villas — watches backyard pools constantly without needing to be deactivated during normal daily use.
  • Community Clubs & Hotels — monitors the usage and capacity of multi-pool spaces, tracking real-time metrics across distinct zones simultaneously.
  • Property Management Networks — brings the state of scattered remote holiday rentals to your screen, ensuring vacant pools are kept safe and clean.
  • Eco-Resorts & Off-grid Pools — a clear, live view of natural pools or remote thermal tanks, flagging water parameters while optimizing pump runtime.
  • Commercial Aqua Centers — acts as an added layer of safety next to on-duty staff, continuously compiling automated audit trails.

A Greener Bottom Line

Every time intelligent chemistry logs help you run filtration pumps dynamically instead of on a static timer, you conserve massive energy and reduce waste. Coral MYLO adds this up for you in plain numbers — for today and for the month.

What You Will See On Screen

Main Dashboard — your whole portfolio at a glance

  • Live Alarms banner and vital-sign cards (Active Alerts, Water Temp, pH Level, TDS ppm, ORP mV, Water Quality Status).
  • Properties map color-coded by safety status, plus system uptime data and a smart-insights feed.

Site Dashboard — a closer look at one pool

  • Pool-bank overview, per-zone tiles color-coded by safety, and the selected pool’s live activity stream.
  • Pool structural overview, recent activity logs, and historical analytics.
  • Water chemistry variations: every drop, every detail, every time.

Why Coral MYLO

The pools that add value to your properties are too important to leave unseen. Coral MYLO gives you a single, clear view of the safety and health of every pool you depend on — and warns you in time to act. Fewer accidents, lower chemical costs, better equipment longevity, and a real, measurable reduction in system downtime — all from one simple, secure platform.
Case Study · Green Tech

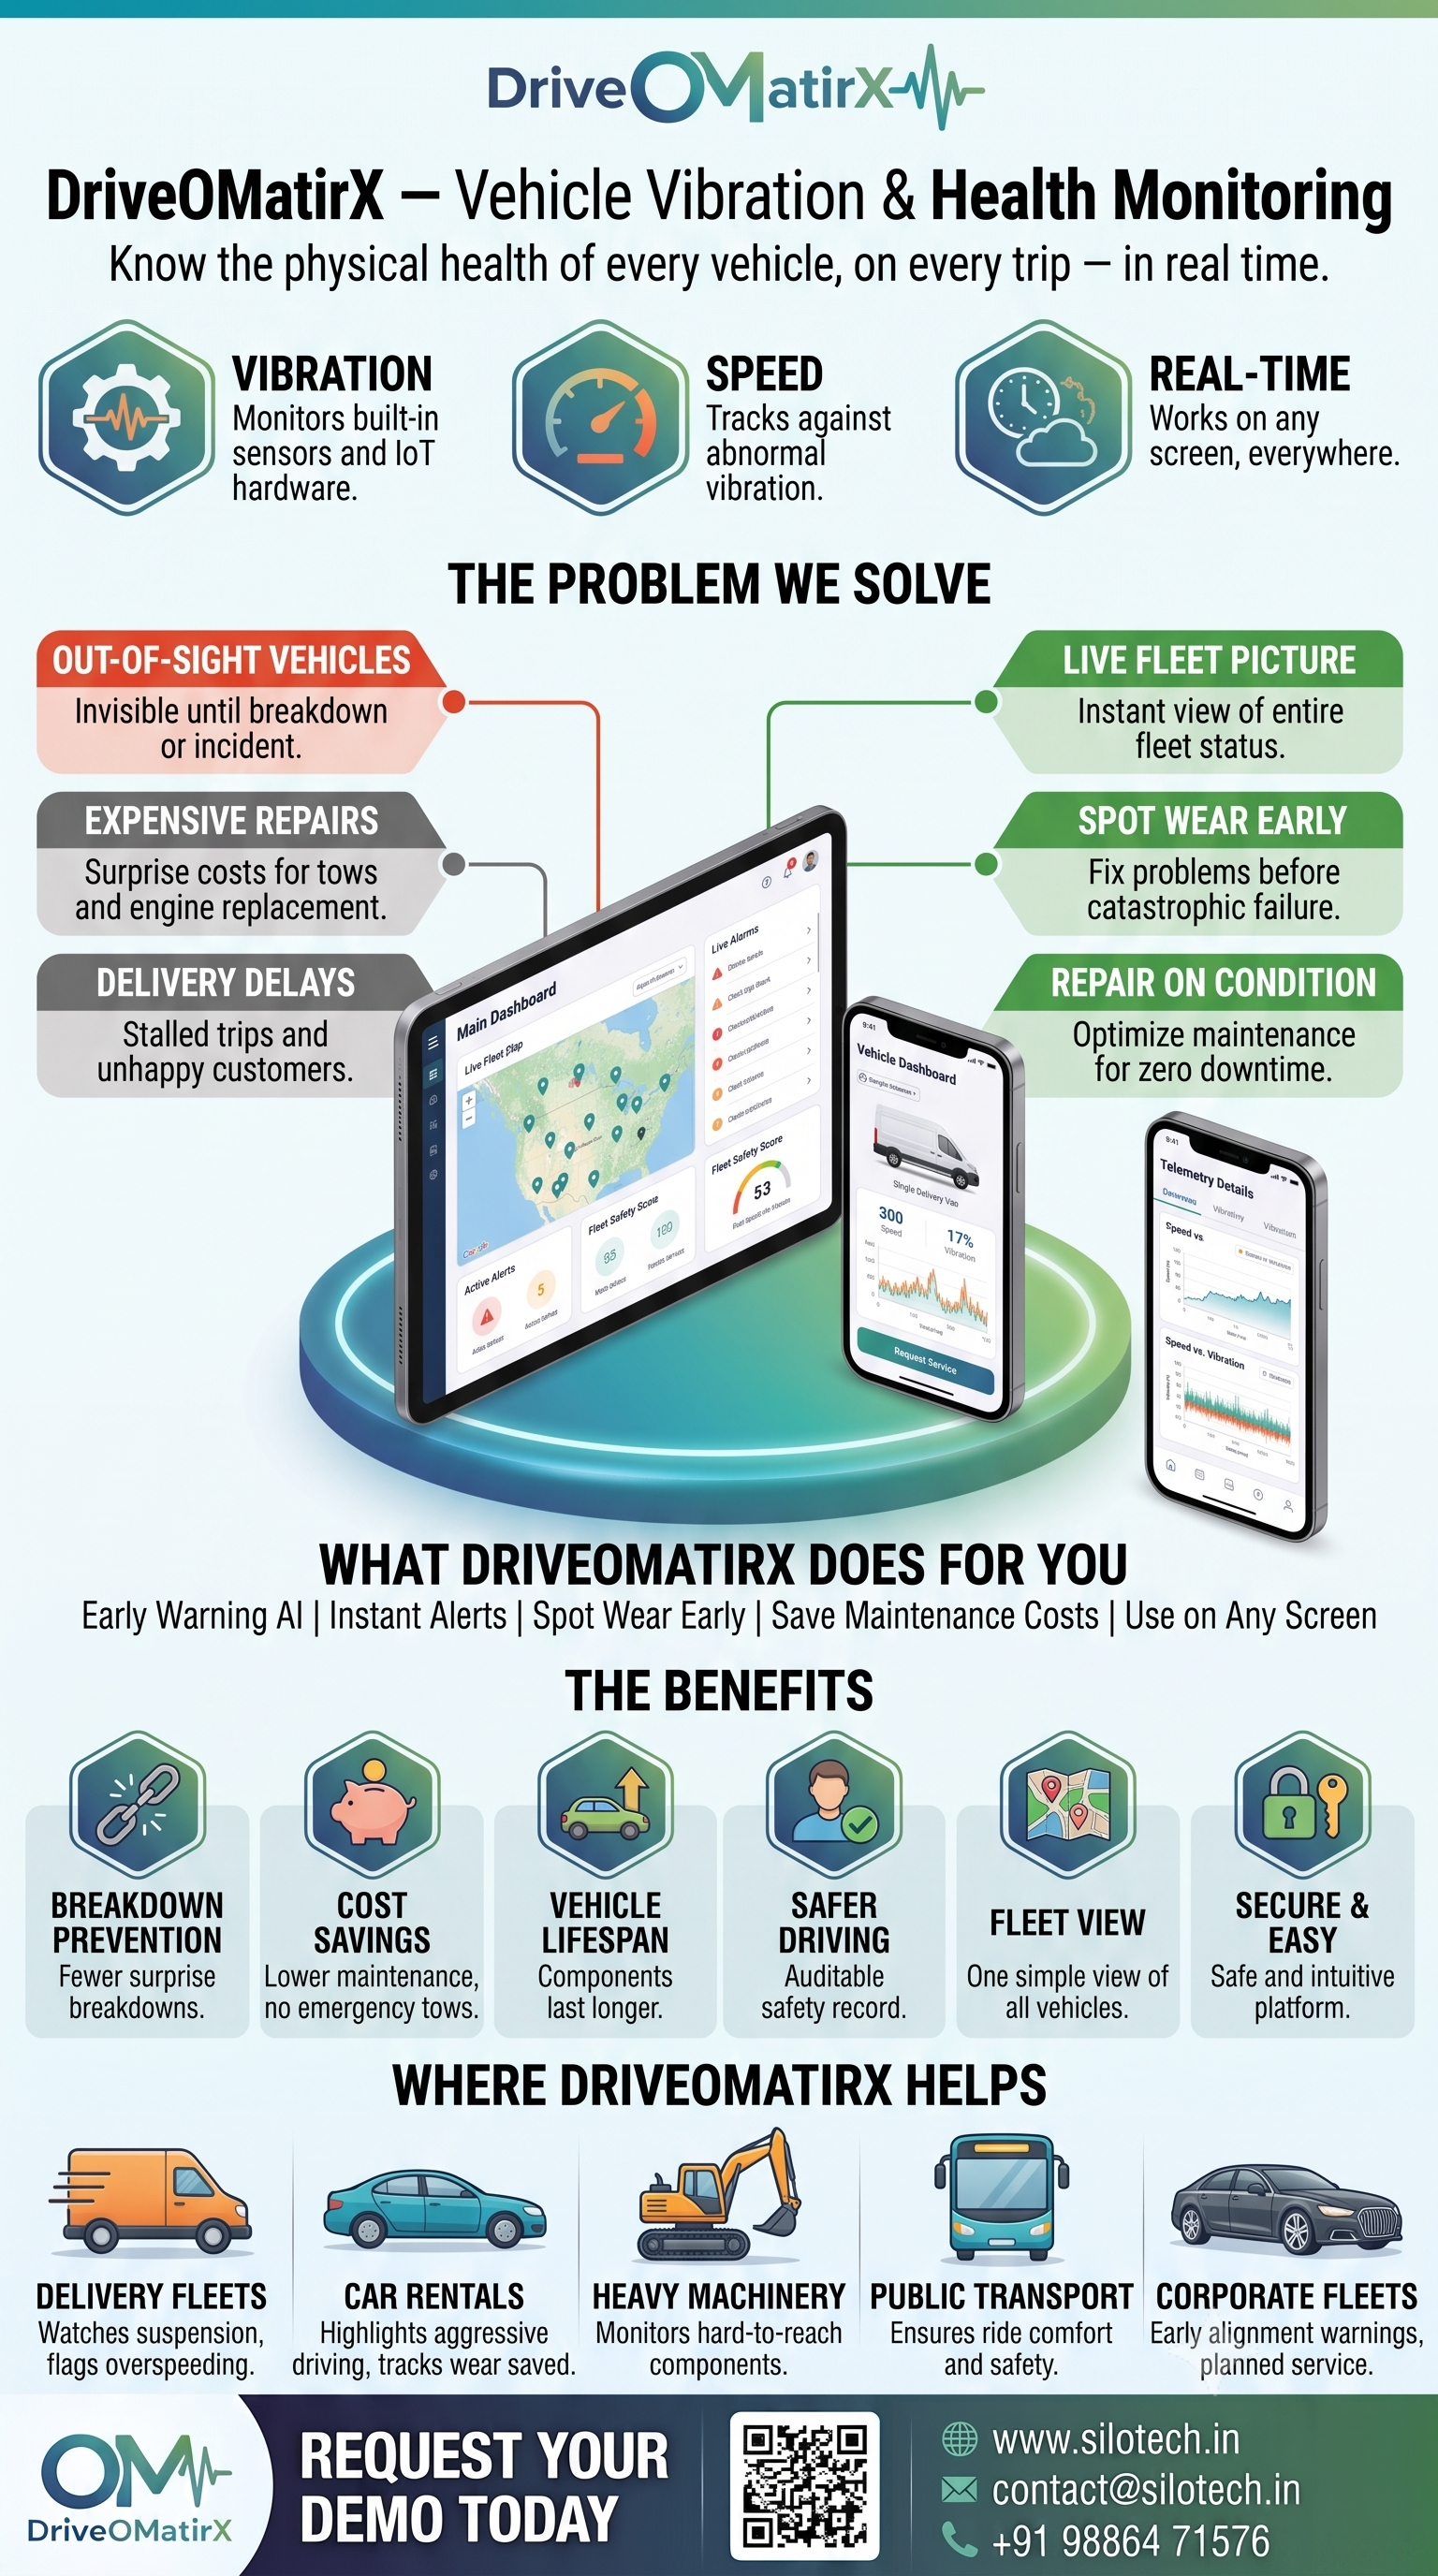
DriveOMatriX — Vehicle Vibration & Health Monitoring

Know the physical health of every vehicle, on every trip — in real time.

Click the image to view it full-screen — scroll to zoom

Overview

DriveOMatriX keeps an eye on the vehicles that keep your business moving — from delivery fleets and rental cars to heavy machinery. It tracks how smoothly each vehicle is running, in real time, on any screen, by monitoring vibrations against speed using built-in smartphone sensors and IoT hardware. The moment a vehicle vibrates abnormally or overspeeds, it warns you straight away, so you can fix small mechanical problems before they turn into a breakdown.

The Problem We Solve

Vehicles on the road are out of sight — until they break down or are involved in an incident. By then, the damage is usually a stalled delivery, an emergency tow, or an expensive engine replacement. DriveOMatriX gives teams a simple, live picture of how every vehicle is performing physically across their entire fleet.

What DriveOMatriX Does for You

  • See all your vehicles and their physical condition live, from one place.
  • Get an instant alert the moment a vehicle experiences abnormal vibrations or overspeeding.
  • Spot mechanical wear early — before the vehicle breaks down.
  • See how much maintenance cost and downtime you are saving.
  • Arrange the screens and alerts your way — no software changes needed.
  • Use it on a computer, tablet, or phone.

Predict Problems Before They Happen

DriveOMatriX does more than tell you when a vehicle has broken down — our AI algorithm helps you see trouble coming, so your team can plan ahead instead of rushing to an emergency recovery.

  • Early warning — worn bearings, misalignment, or engine stress are flagged well before they fail based on unique vibration signatures.
  • Repair on condition, not guesswork — service a vehicle only when the vibration data shows it truly needs it.
  • Fewer surprise breakdowns — small mechanical issues are caught and fixed while they are still small.

Plan and Track Maintenance

  • Schedule inspections and repairs, with reminders based on actual vehicle stress and AI profiling.
  • Keep a complete history for every vehicle — speed logs, vibration anomalies, notes, photos, and documents in one place.
  • Hand over smoothly — when fleet managers change, the full mechanical record stays with the vehicle.

The Benefits

  • Fewer breakdowns and fewer unpleasant surprises on the road.
  • Fewer emergency tows and shorter repair times — and lower costs.
  • Longer vehicle lifespan — service components before catastrophic failure.
  • Safer driving habits and a clear, auditable safety record.
  • One simple view for your whole fleet of vehicles.
  • Safe, secure, and easy for anyone to use.

Other Handy Features

  • Health at a glance — every vehicle green for healthy, amber for caution (vibrations detected), and red for urgent (critical hazard or overspeed).
  • Instant alerts by vehicle, so the right maintenance team responds quickly.
  • Simple reports you can view, share, or download.
  • Maintenance savings and safety scores tracked automatically.
  • A map of all your active vehicles in one view.
  • Your own dashboard — arrange the screens and numbers you care about most.

Where DriveOMatriX Helps

  • Delivery Fleets — watches suspension and engine health on every van at once and warns the instant one vibrates abnormally; flags overspeeding that can signal unsafe driving.
  • Car Rentals — shows the health of every car, highlights aggressive driving early, and tracks the wear and tear saved.
  • Heavy Machinery & Construction — keeps a constant eye on each machine’s hard-to-reach components and lets you plan a single, well-timed maintenance check.
  • Public Transport / Buses — monitors the physical comfort and safety of the ride, warning you before a mechanical problem can take a bus out of service.
  • Corporate Fleets — watches every company car, gives early warning on vehicles needing alignment or engine work, and helps you replace parts on a planned schedule.

A Safer Bottom Line

Every time you catch a mechanical issue early instead of waiting for a breakdown, you save money and keep drivers safe. DriveOMatriX adds this up for you in plain numbers — showing safety scores and maintenance savings for today and for the month.

What You Will See On Screen

Main Dashboard — your whole fleet at a glance

DriveOMatriX main dashboard
  • Live Alarms banner and fleet vital-sign cards (Active Alerts, Avg Speed, Max Vibration (g-force), Active Vehicles, Fleet Safety Score).
  • Live map colour-coded by status, plus safety trends and a smart-insights feed from our AI.

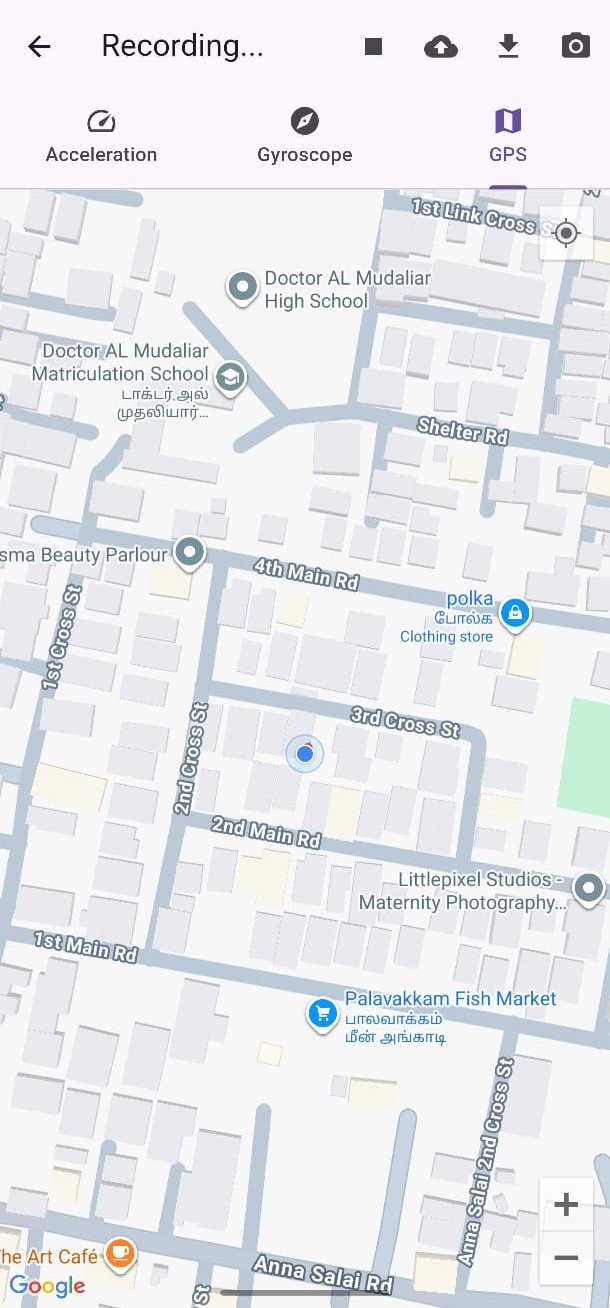
Vehicle Dashboard — a closer look at one vehicle

DriveOMatriX vehicle dashboard
  • Vehicle overview, trip tiles colour-coded by health, and the selected vehicle’s current speed, vibration profile, and location.
  • Telemetry graphs and this vehicle’s maintenance history.

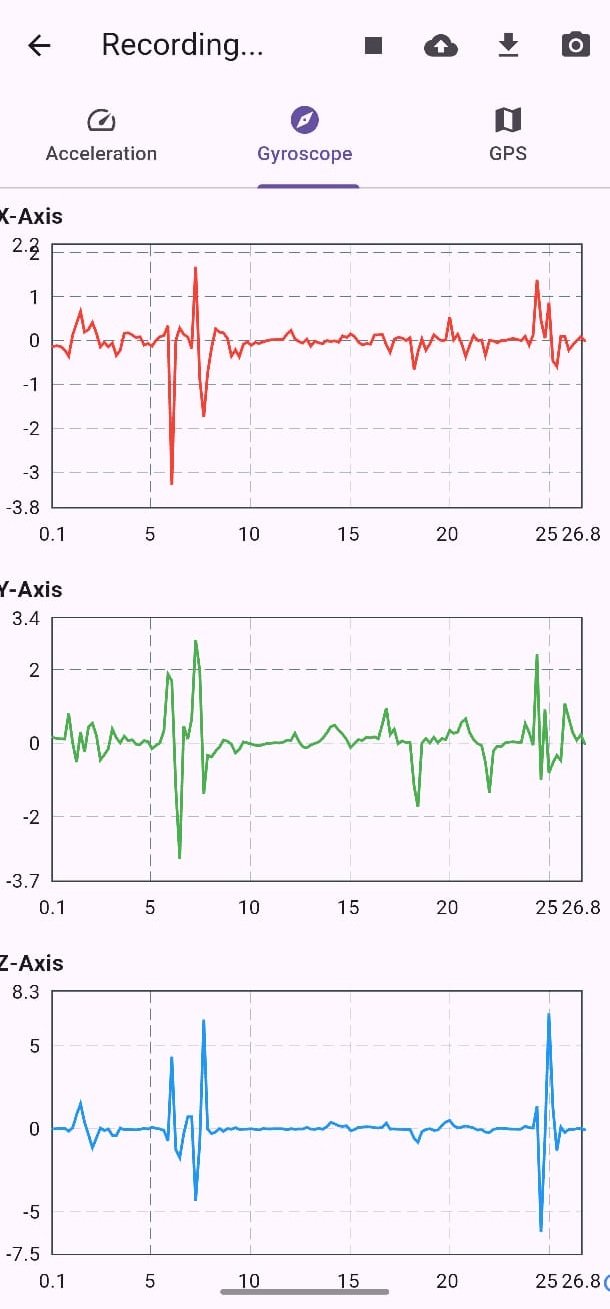
Telemetry Details

DriveOMatriX telemetry details

AI-generated Speed vs. Vibration analysis charts.

Why DriveOMatriX

The vehicles that keep your business moving are too important to leave unmonitored. DriveOMatriX gives you a single, clear view of the physical health and safety of every vehicle you depend on — and warns you in time to act. Fewer breakdowns, lower costs, longer-lasting vehicles, and a real, measurable increase in safety — all from one simple, secure platform.
Case Study · Green Tech

Business on Wheels — Customized Electric Vending Carts

Take your brand to the customer — a premium, 100% electric mobile storefront.

Click the image to view it full-screen — scroll to zoom

Overview

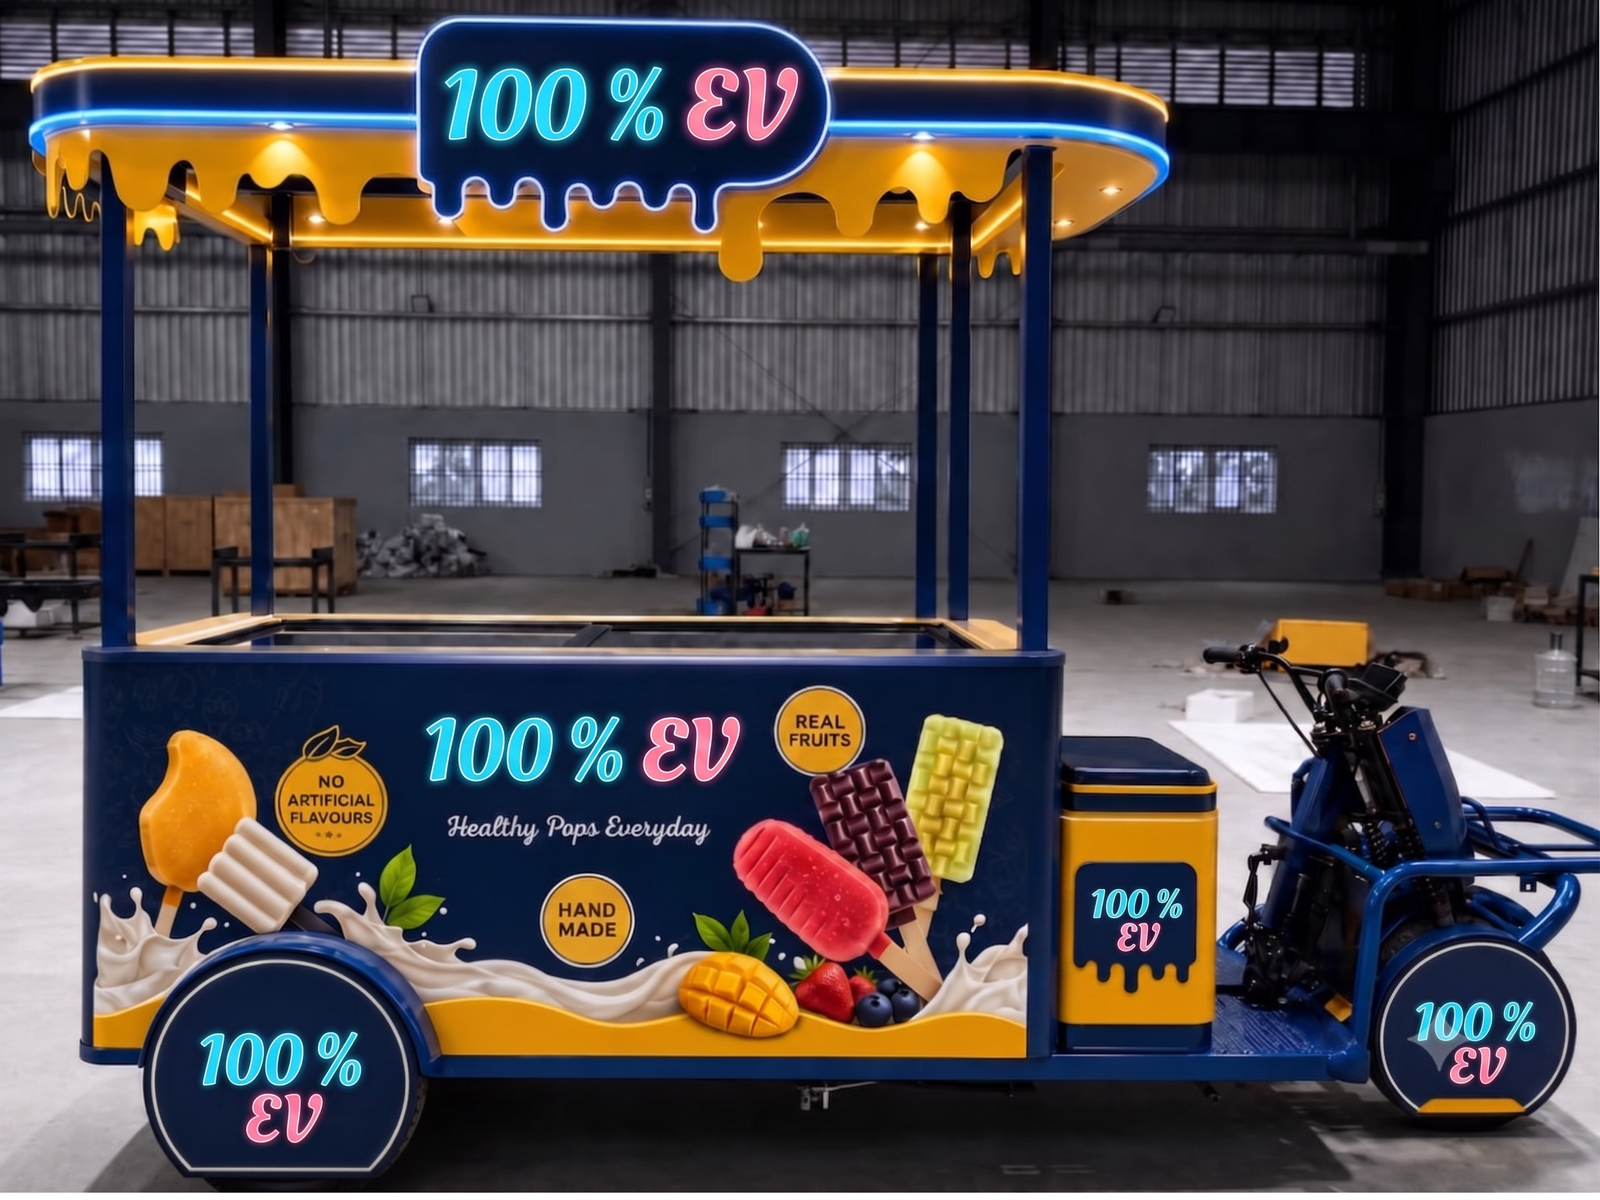
Business on Wheels is a premium, mobile, 100% electric vending platform designed to take retail directly to the consumer. By combining automotive-grade engineering, bespoke brand styling, and high-efficiency electric mobility, the platform offers modern retail brands a highly reliable, cost-effective, and fully scalable avenue for physical market expansion.

The Problem We Solve

Traditional brick-and-mortar retail requires immense capital expenditure, long deployment timelines, and fixed locations that cannot adapt to shifting consumer foot traffic. Conversely, typical mobile street vending solutions lack a premium aesthetic, suffer from low manufacturing durability, rely heavily on low-quality imported parts, and generate high operational or maintenance costs. Business on Wheels bridges this gap by delivering a premium, highly durable, emission-free storefront that moves fluidly to where demand is highest.

What Business on Wheels Does for You

  • Takes Your Brand Mobile: Grants immediate location flexibility and expanded geographic sales reach to target peak high-traffic hours dynamically.
  • Bespoke Identity Engineering: Offers a dedicated industrial design team to build customized vehicle aesthetics, full-wrap styling, and tailored interior layouts that align with your marketing guidelines.
  • Provides All-Day Dependability: Equips your retail operation with a robust, extended-range electric powertrain built for continuous, reliable daily deployment.

The Benefits

  • Enhanced Brand Perception: A sleek, premium customer appearance instantly elevates visual appeal and perceived value on the street.
  • Superior Ride & Stability: Built with proven automotive engineering concepts derived from developing heavy-use EV platforms, resulting in better ride quality, operator comfort, and physical cart durability.
  • 100% Sovereign Technology: Uses indigenous, Indian-manufactured motors, battery systems, and drive electronics — completely removing dependence on cheap imports for faster service and parts availability.
  • Seamless Maneuverability: A highly compact design footprint allows operators to effortlessly navigate tight street configurations and urban spaces.

Other Handy Features

  • Scalable Architecture: The physical and mechanical platform is deliberately engineered to adapt, grow, and morph as your operational capacity scales.
  • Low Maintenance Design: Optimized engineering layouts require fewer service intervals, minimizing standard wear-and-tear friction points.
  • Simple Operator Controls: Simple mechanical systems and straightforward operational layouts make it exceptionally easy for team members to drive, park, and deploy safely.
  • Massive Production Capability: Backed by a dedicated 20,000 sq. ft. manufacturing facility in Jigani, Bengaluru, ensuring highly standardized builds and predictable rollouts for large fleet orders.

Where Business on Wheels Helps

  • Street Food & Beverages / Ice Cream & Desserts
  • Specialty Coffee & Quick Service Cafés
  • Mobile Apparel & General Retail Displays
  • Event Catering & Experiential Pop-Up Stores
  • Brand Activation & Corporate Sampling Campaigns
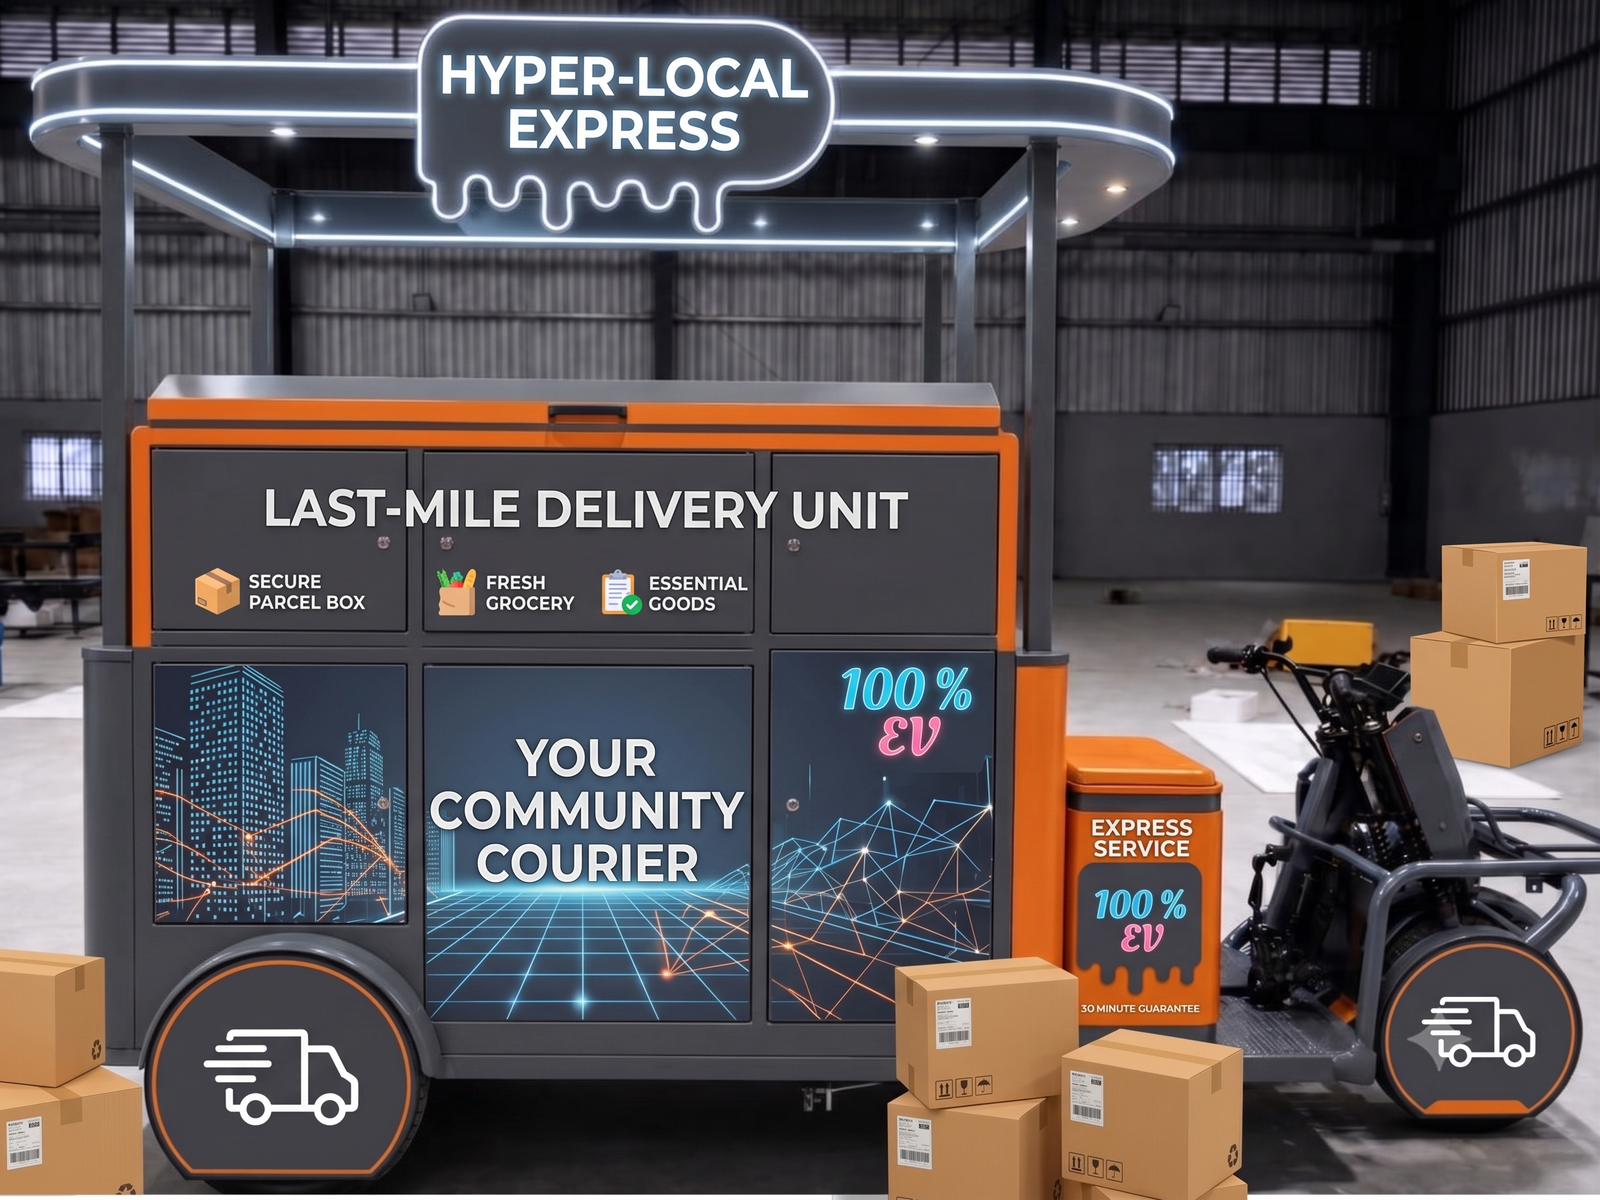
  • Hyper-local Last-Mile Delivery Units

A Safer Bottom Line

Business on Wheels drives profitability by replacing high fixed operational costs with a highly optimized, low-operating-cost electric infrastructure. By utilizing zero-emission, clean energy, businesses circumvent volatile fuel expenses and costly internal combustion maintenance overheads. This creates a lean, highly profitable, and risk-mitigated retail deployment strategy that protects your margins while expanding your physical presence.

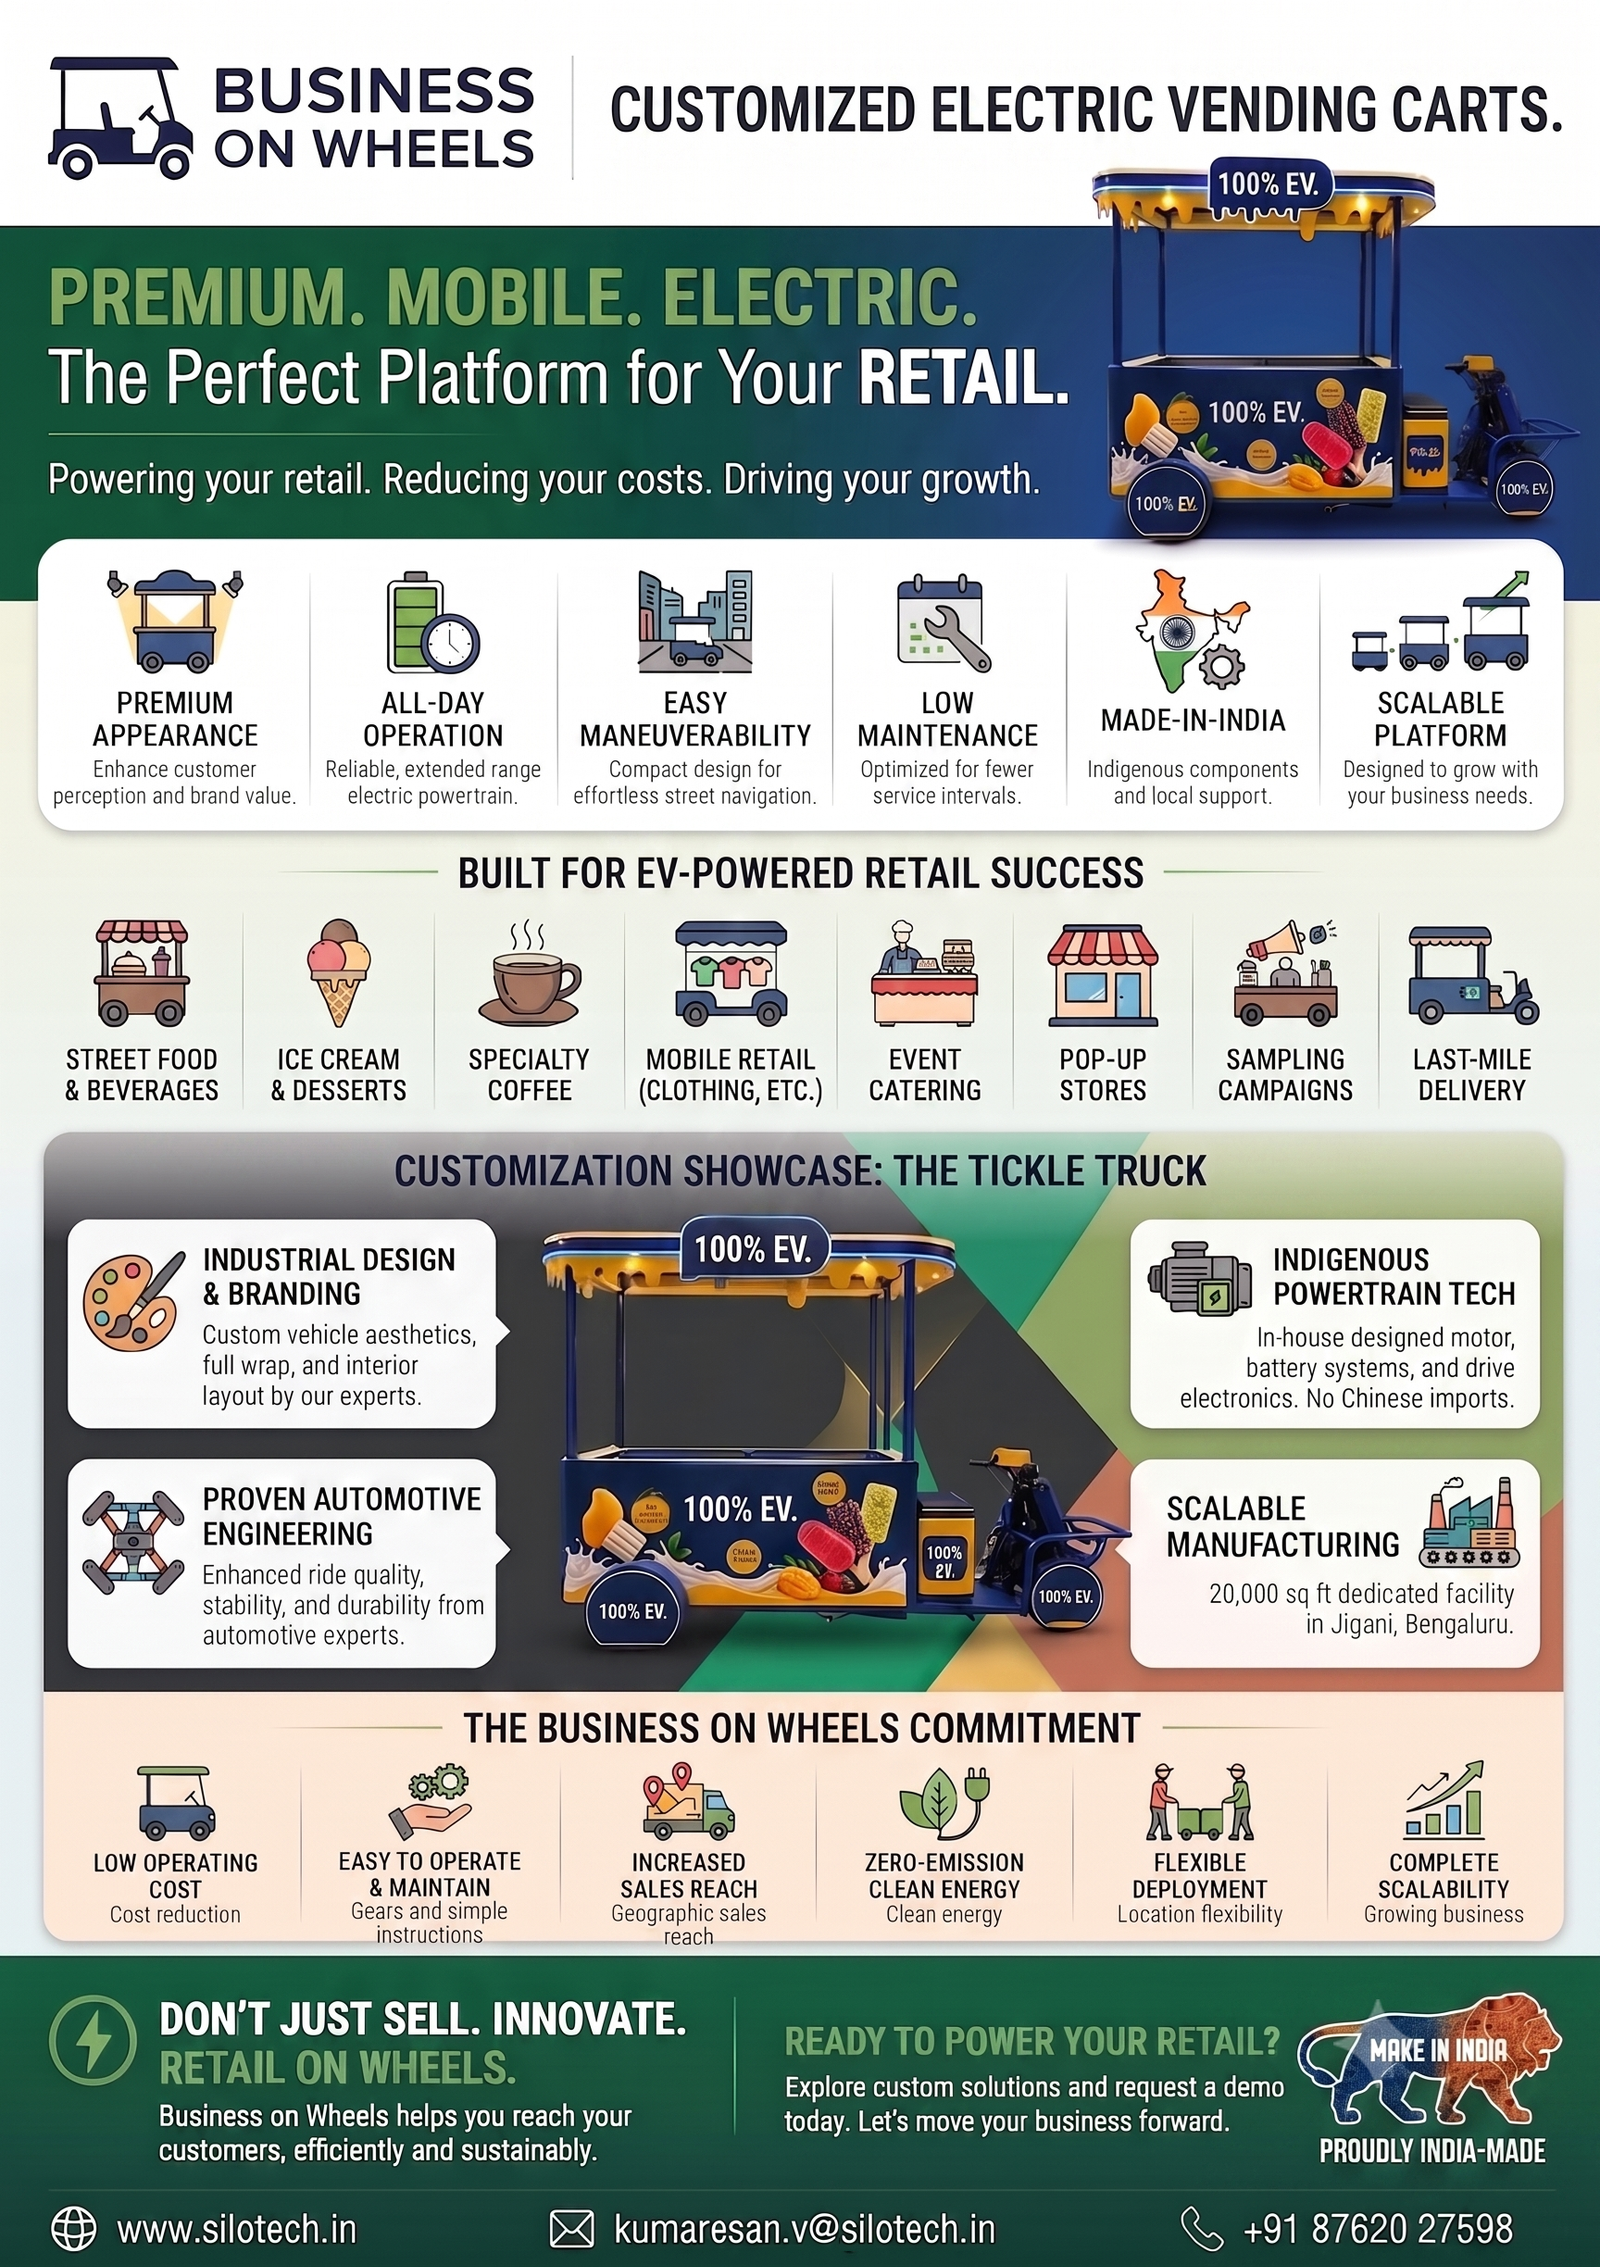
What You Will See

Business on Wheels electric vending cartBusiness on Wheels electric vending cartBusiness on Wheels electric vending cart

Why Business on Wheels

Because it represents the convergence of world-class engineering and localized, resilient production. Developed by automotive experts with a track record of engineering logistics solutions for enterprise global markets, Business on Wheels provides a meticulously controlled supply chain. With an indigenous powertrain, local components, and a dedicated manufacturing facility in Karnataka, it is proudly designed, built, and supported right here in India to drive your retail growth sustainably.

Case Study · Ed Tech & Productivity

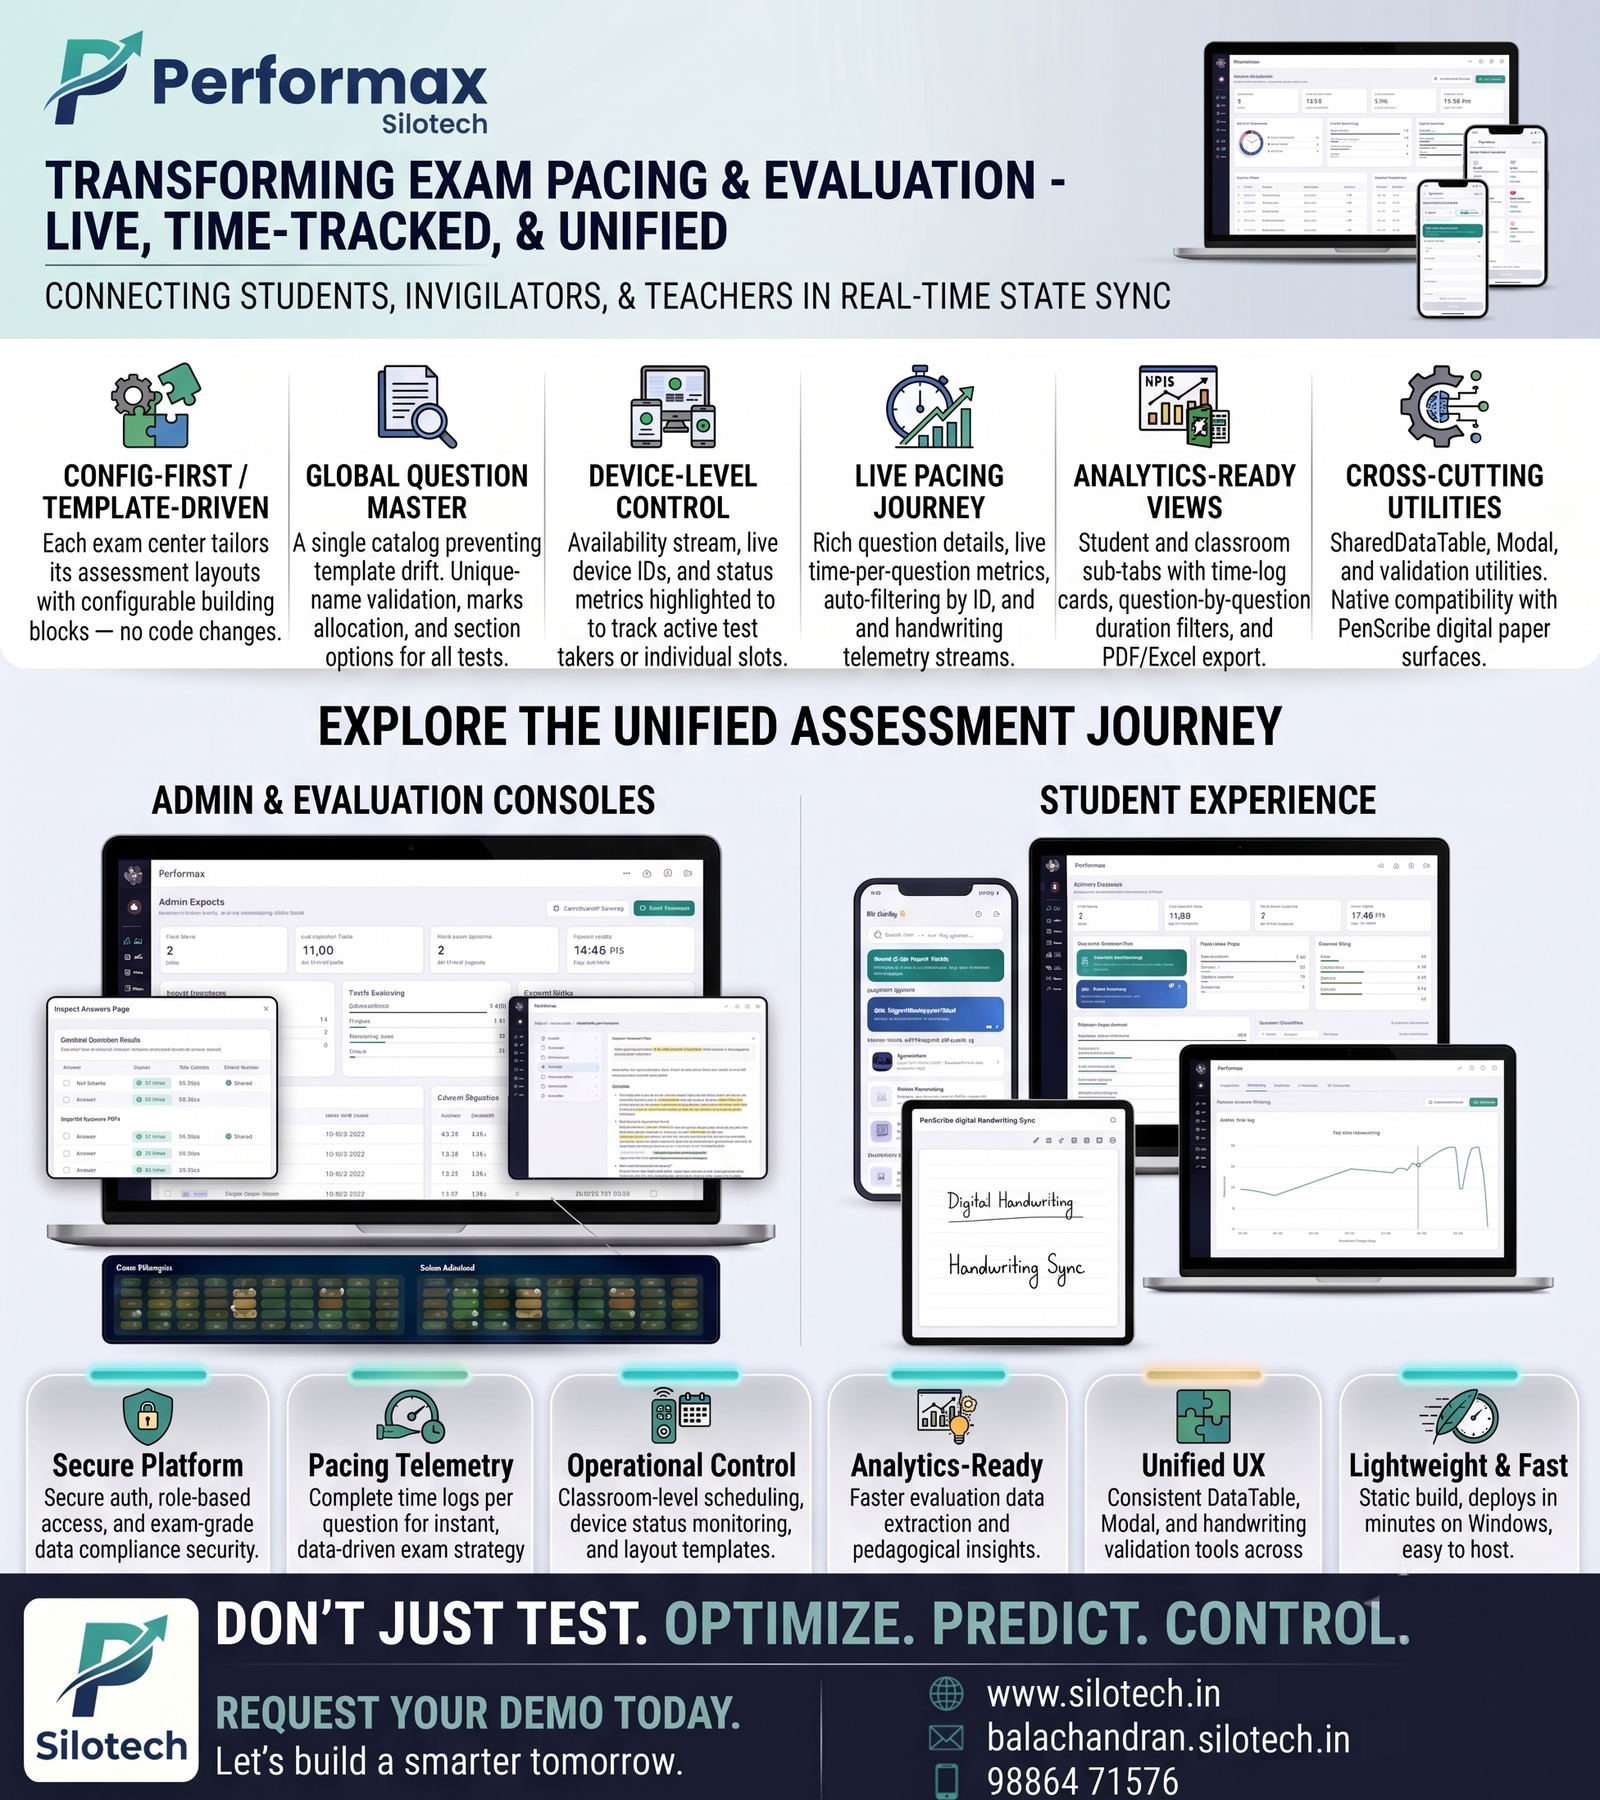
Performax — Your Personalised Exam & Performance Trainer

Real-time pacing insights and paperless evaluation — so every student finishes strong.

Click the image to view it full-screen — scroll to zoom

Overview

Performax keeps an eye on the exams and assessments that keep your institutions running — across schools, competitive exam centers, and universities. It shows how efficiently each student is answering questions, in real time, on any screen. The moment a student struggles or a question causes a bottleneck, it highlights it straight away, so you can optimize test designs and teaching methodologies before it impacts final results.

The Problem We Solve

Students at exam halls are out of sight regarding their mental pacing — until they run out of time or fail a section. By then the damage is usually exam stress, unfinished answers, or poor grades. Performax gives educators a simple, live picture of how every student is managing their time across all test versions and question types.

What Performax Does for You

  • See all of your connected exam devices and students live, from one place.

  • Get an instant live view of student handwriting according to specific device IDs.

  • Spot weak pacing and time traps early — before students run out of time.

  • See how much evaluation time and physical paper you are saving.

  • Arrange question templates and answer sheets your way — with seamless PDF imports.

  • Use it on a computer, tablet, or specialized electronic gadget.

Predict Pacing Issues Before They Happen

Performax does more than tell you when a student has failed an exam — it helps you see timing trouble coming, so your teaching team can adjust strategies instead of dealing with poor exam outcomes.

  • Early warning — questions that are unclear or overly time-consuming for their marks are flagged well before the test ends.

  • Evaluate on data, not guesswork — adjust exam difficulty-to-time ratios based on hard telemetry rather than assumptions.

  • Fewer surprise failures — pacing issues and tricky topics are caught and fixed while students are still in the learning cycle.

Plan and Track Evaluation

  • Schedule digital assessments and mock tests, with time-tracking logs built into every session.

  • Keep a complete history for every student and exam — checks, time logs, evaluation results, and timestamps in one place.

  • Hand over smoothly — digital annotations, grading marks, and audio logs stay securely linked with the student record.

The Benefits

  • Better time management and fewer skipped questions due to “hard question” panic.

  • Fewer physical papers to carry — clear, paperless, and digital grading workflows.

  • Improved student performance — less rushing leads to fewer careless mistakes.

  • Lower printing bills and a clear, modern sustainability story through digital submission.

  • One simple view for your whole fleet of classrooms or exam centers.

  • Safe, secure, and easy for any teacher or student to use.

Other Handy Features

  • Pacing at a glance — time duration for each answer tracked automatically to evaluate speed vs. accuracy.

  • Instant device filtering — sort live evaluation streams by device IDs so the right invigilator or teacher responds quickly.

  • Simple reports — export graded PDFs complete with answer durations, timestamps, and device details.

  • Paper-like feel integration — compatible with PenScribe tools to maintain natural handwriting postures and speed without the slippery tablet feel.

  • Template builder — highlight, select, and import custom question PDFs into the platform instantly.

  • Your own dashboard — arrange the live feeds and student vital-sign cards you care about most.

Where Performax Helps

  • School Assessments — watches student progress across classrooms, flagging if specific topics require immediate re-teaching.

  • Competitive Exams (SAT, GRE) — monitors critical time-per-question metrics where precise pacing determines top rankings.

  • University Exams — handles complex essay or math evaluations digitally, ensuring consistency across different test versions.

  • Remote & Online Tutoring — projects handwriting sessions via screen mirroring in real time, making distant learning deeply interactive.

  • STEM Classrooms — perfect for tracking real-time step-by-step drafting of equations, graphs, and technical diagrams.

An Efficient Bottom Line

Every time an evaluation happens digitally instead of on physical sheets, you save administrative hours, eliminate paper waste, and gain deep pedagogical insights. Performax adds this up for you in plain numbers — showing time saved per test and performance boosts per student.

What You Will See On Screen

  • Main Dashboard — your whole student fleet at a glance: live view of connected devices, student handwriting feeds by ID, and eight evaluation vital-sign cards (Active Tests, Avg Time per Question, Accuracy Rate, Total Tests Evaluated, Avg Score, Paper Saved, Session Logs).

  • Inspect Answers Page — a closer look at a student: an editing and evaluation interface showing the student’s raw handwriting alongside the exact duration spent on that specific question template.

  • Template Manager — imported question PDFs with custom highlight overlays matching the respective answer sheet layouts.

  • Exported Analytics Feed — downloadable PDFs detailing final grades, precise timestamps, and localized question-by-question time telemetry.

Why Performax

The exams that validate your students’ hard work are too important to leave unmeasured. Performax gives you a single, clear view of the test-taking efficiency of every learner you depend on — and warns you in time to optimize their strategy. Better time management, lower stress, higher test accuracy, and data-driven teaching — all from one simple, secure platform.
Case Study · Ed Tech & Productivity

IaaS — Inventory as a Service

Know where every item is, every moment — from gate-in to proof of delivery.

Click the image to view it full-screen — scroll to zoom

Overview

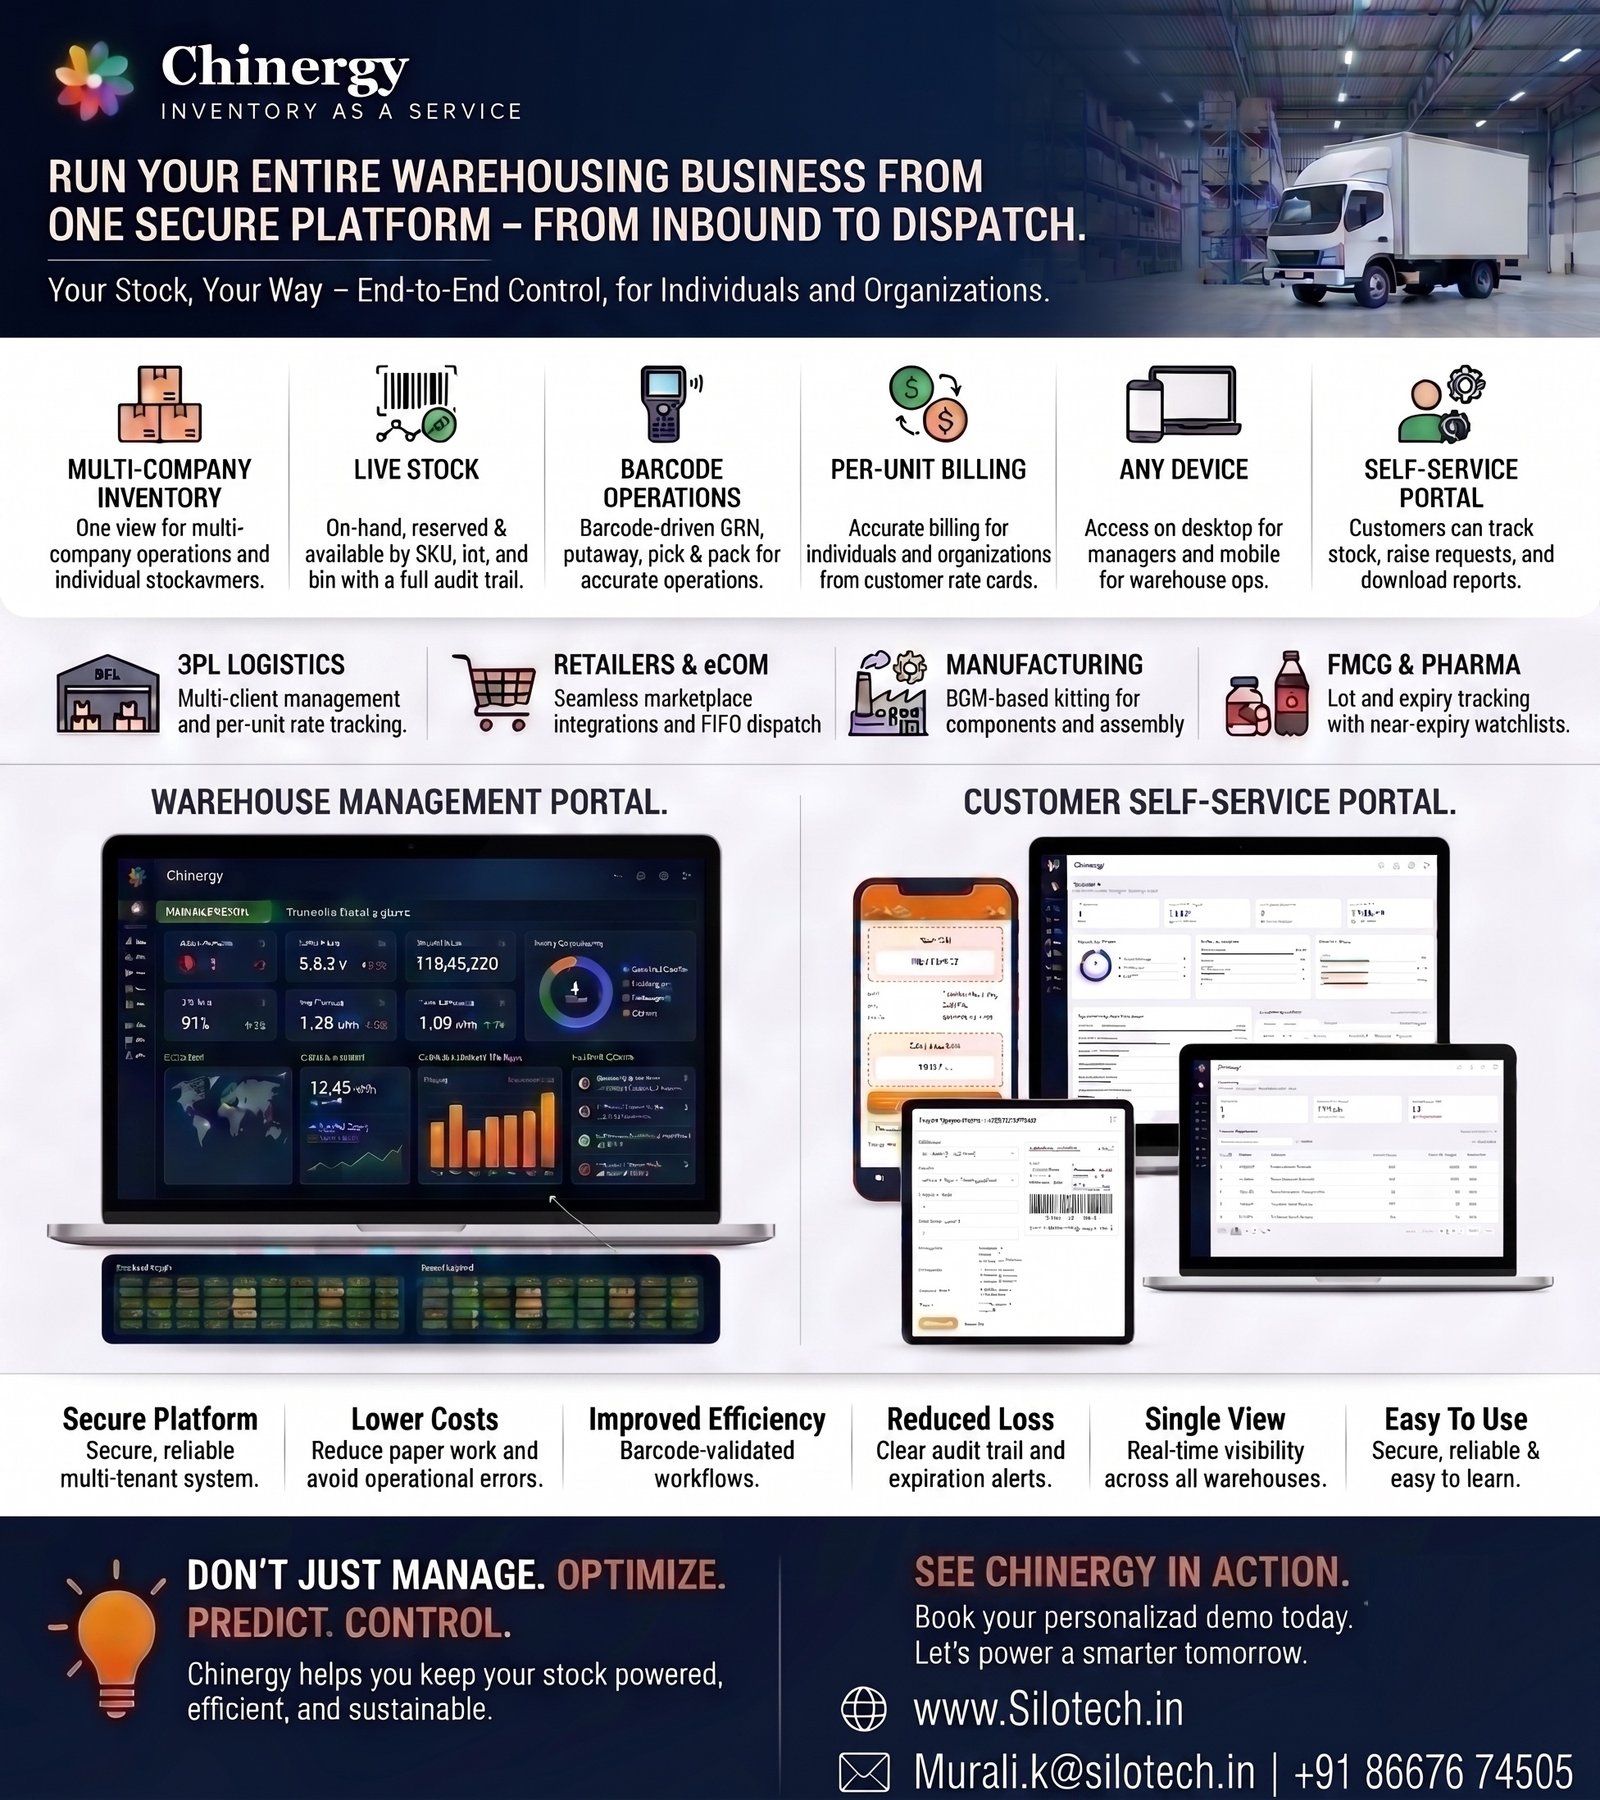
IaaS runs your entire warehousing business from one secure platform. Whether you store goods for one company or fifty, it tracks every item, every pallet and every bin — live, on any screen. Goods are scanned in at the gate, scanned onto shelves, and scanned out to your customers' doorsteps, so the system always knows exactly what is where, who it belongs to, and what it is worth. Your customers get their own portal to watch their stock without calling you.

The Problem We Solve

Shared warehouses run on trust — and on spreadsheets. Stock counts drift, expiry dates slip past unnoticed, customers ring up asking “where is my stock?”, and month-end billing turns into days of manual reconciliation. By the time a mistake surfaces, it is usually a short shipment, an expired lot, or a billing dispute. IaaS gives everyone — warehouse teams, managers and customers — one live, accurate picture of every item across every location.

What IaaS Does for You

  • See every item, lot, pallet and bin across all your warehouses — live, from one place.
  • Run the whole flow with barcode scans: receive, put away, pick, pack, dispatch, deliver.
  • Keep every customer's stock strictly separate — each sees only their own goods.
  • Bill automatically — storage and every activity priced from each customer's rate card.
  • Let customers help themselves: their own portal for stock, orders, returns and reports.
  • Use it on a computer, tablet, phone or handheld scanner.

Know Before You Run Out

IaaS does more than count stock — it watches it, so your team can act before a problem costs money.

  • Expiry watched daily — lots nearing expiry are flagged well in advance, and stock always ships first-expiry-first-out (FEFO), automatically.
  • Low stock flagged early — items falling below reorder level appear on the dashboard before they run dry.
  • Slow movers surfaced — stock ageing past 90 days is highlighted, so storage charges never come as a surprise to your customer.

Plan and Track Every Movement

  • Customers announce inbound shipments (ASN) in advance, so the dock is ready before the truck arrives.
  • Every receipt, move, split, kit, pick and dispatch is scanned and ledger-logged — a complete history for every handling unit.
  • Photos and documents (invoices, GRNs, PODs, licences) attach to every transaction and stay with the record.
  • A built-in calendar, alerts and maker-checker approvals keep holds, write-offs and releases under control.
  • When staff change, nothing is lost — the full record stays with the stock.

The Benefits

  • Fewer stock-outs, short shipments and expired write-offs.
  • Faster receiving and dispatch — barcode scans instead of paperwork.
  • Billing that adds itself up — no month-end reconciliation marathons.
  • Happier customers who can see their own stock and stop calling to ask.
  • Longer-lasting accuracy — cycle counts and audit trails keep the books true.
  • One platform for every warehouse, company and customer you serve.

Other Handy Features

  • Occupancy at a glance — a live warehouse map of zones, racks and bins: white for empty, amber for partial, green for full. Filter by customer, category, ageing or expiry and the right bins light up.
  • Excel-style filters everywhere — every table filters, sorts, searches and exports to Excel.
  • Colour-coded status pills on every document — from Requested to Delivered · POD.
  • Instant alerts by email, with SMS and WhatsApp ready to switch on.
  • Dashboards per role — warehouse ops, management, inventory and live stock, each with drill-down detail popups.
  • Rate cards per customer — storage, receiving, dispatch, kitting, break-bulk, labelling and more, each priced individually.

Your Customers See It Too

The Customer Portal gives every tenant a secure window into their own world: live stock by SKU, lot and bin, ageing and expiry watchlists, inbound ASN tracking, dispatch tracking with proof of delivery, service requests with charges shown up front, their own product catalogue with photos and documents — and every report exportable to Excel. Their stock, their numbers, nobody else's.

Where IaaS Helps

  • Food & FMCG — FEFO picking and expiry watchlists keep short-dated stock moving and write-offs low.
  • Pharma & Medical — lot and batch tracking end to end, quarantine and QC holds, and instant recall traceability.
  • Electronics & Consumer Goods — serial-friendly handling units, kitting for bundles and combos, warranty records per item.
  • E-commerce & D2C Brands — multi-channel dispatches with pick-pack-ship discipline and POD capture on every order.
  • Agri & Commodities — bag-and-lot level stock with ageing control and per-bag storage billing.
  • 3PL & Shared Warehousing — many customers under one roof, each billed from their own rate card, each seeing only their own stock.
  • Spare Parts & After-sales — small, high-value items tracked to the exact bin, with break-bulk down to single units.
  • SMEs & Individual Traders — pay-per-use storage with the same live visibility the big customers get.

Billing That Takes Care of Itself

Every pallet-day stored and every activity performed — receiving, putaway, picking, kitting, break-bulk, labelling, returns — is metered against each customer's rate card as it happens. At month-end, GST-ready invoices are generated automatically, with every line traceable back to a scanned transaction. Unbilled work is visible every day, so nothing slips through.

What You Will See On Screen

Main Dashboard — your whole operation at a glance

IaaS main dashboard
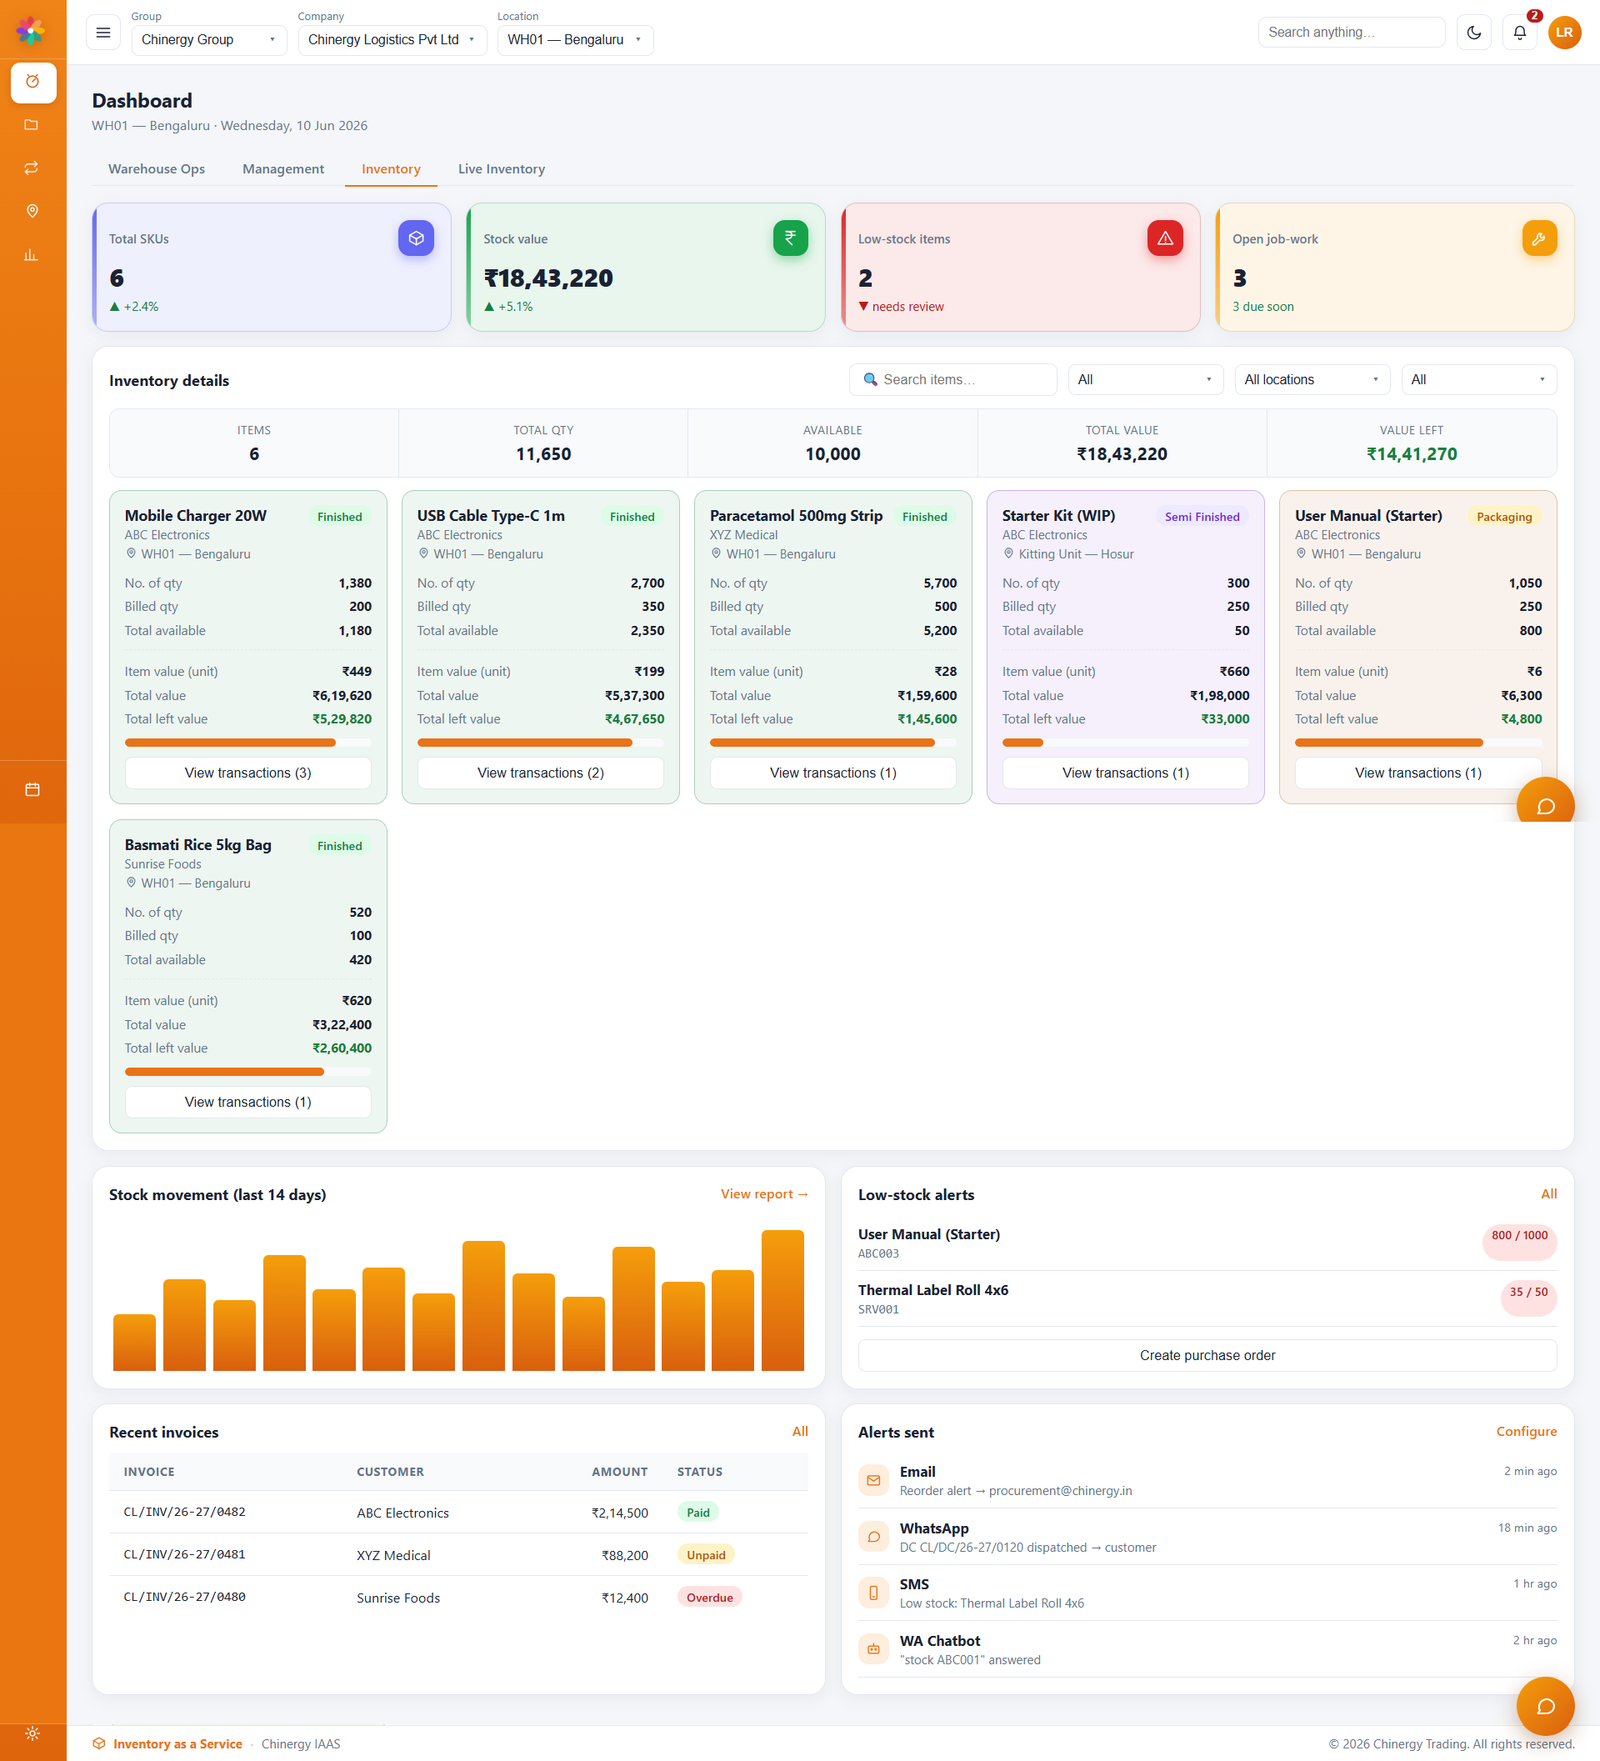
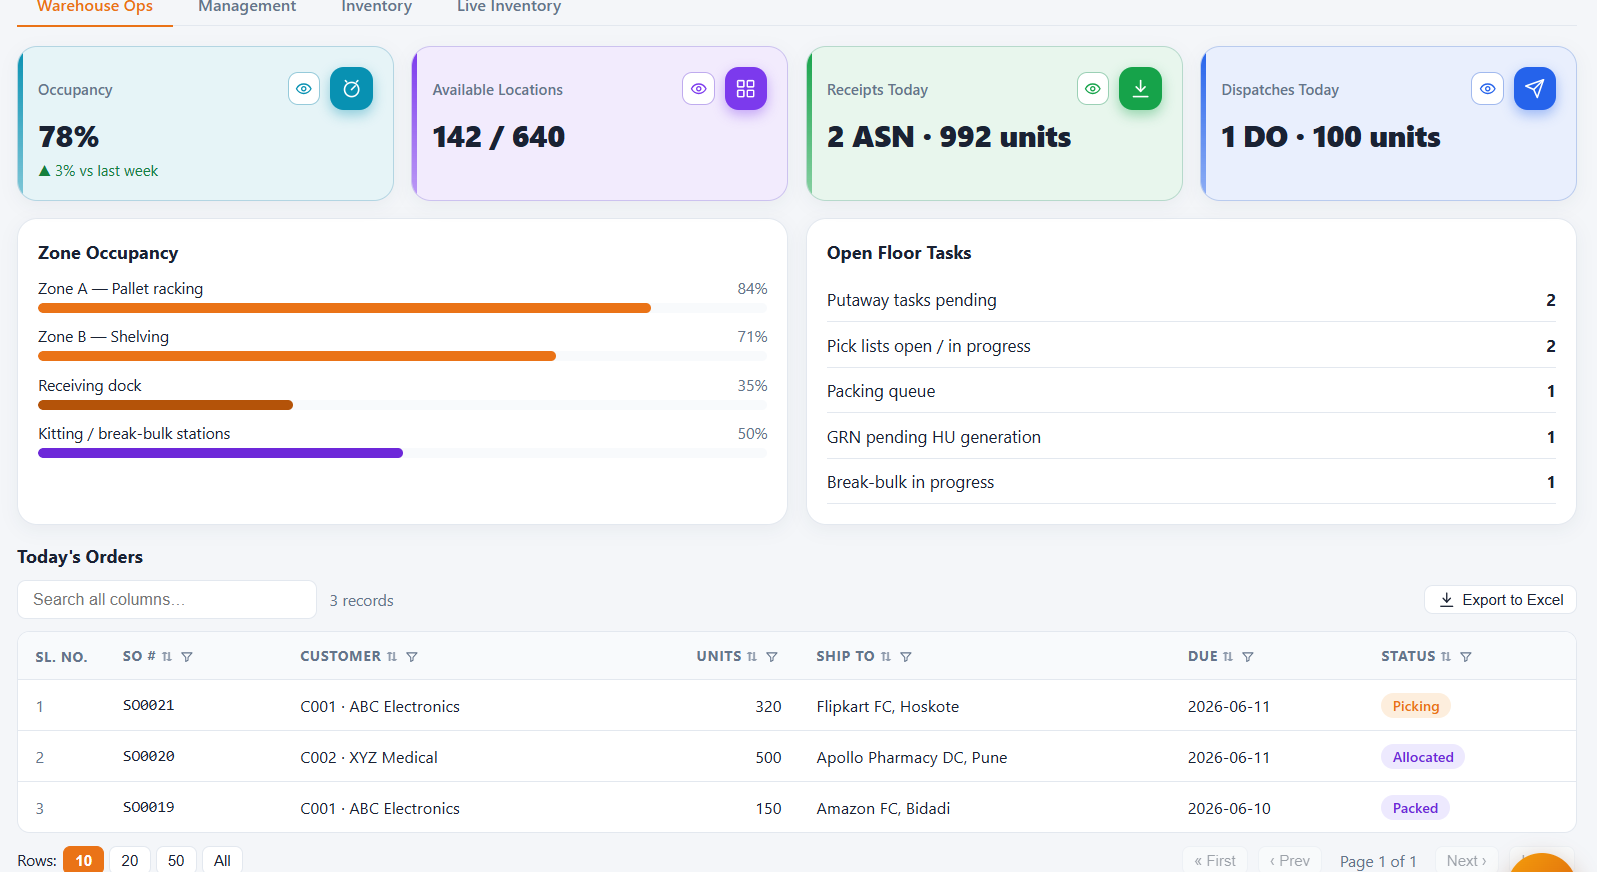
  • Four live tabs: Warehouse Ops, Management, Inventory and Live Inventory.
  • Colour-coded KPI cards — occupancy, available locations, receipts and dispatches today, MTD revenue, storage utilisation, unbilled transactions — each opening a detail popup.
  • Zone occupancy bars, open floor tasks, revenue by customer and top-moving SKUs.

Location Occupancy — the warehouse, drawn live

IaaS location occupancy
  • Zones, racks and bins with fill levels; filter by customer, category, ageing or expiry and watch the right bins light up.
  • Click any bin for its items, transactions, photos and documents.

Customer Portal — what each tenant sees

IaaS customer portal
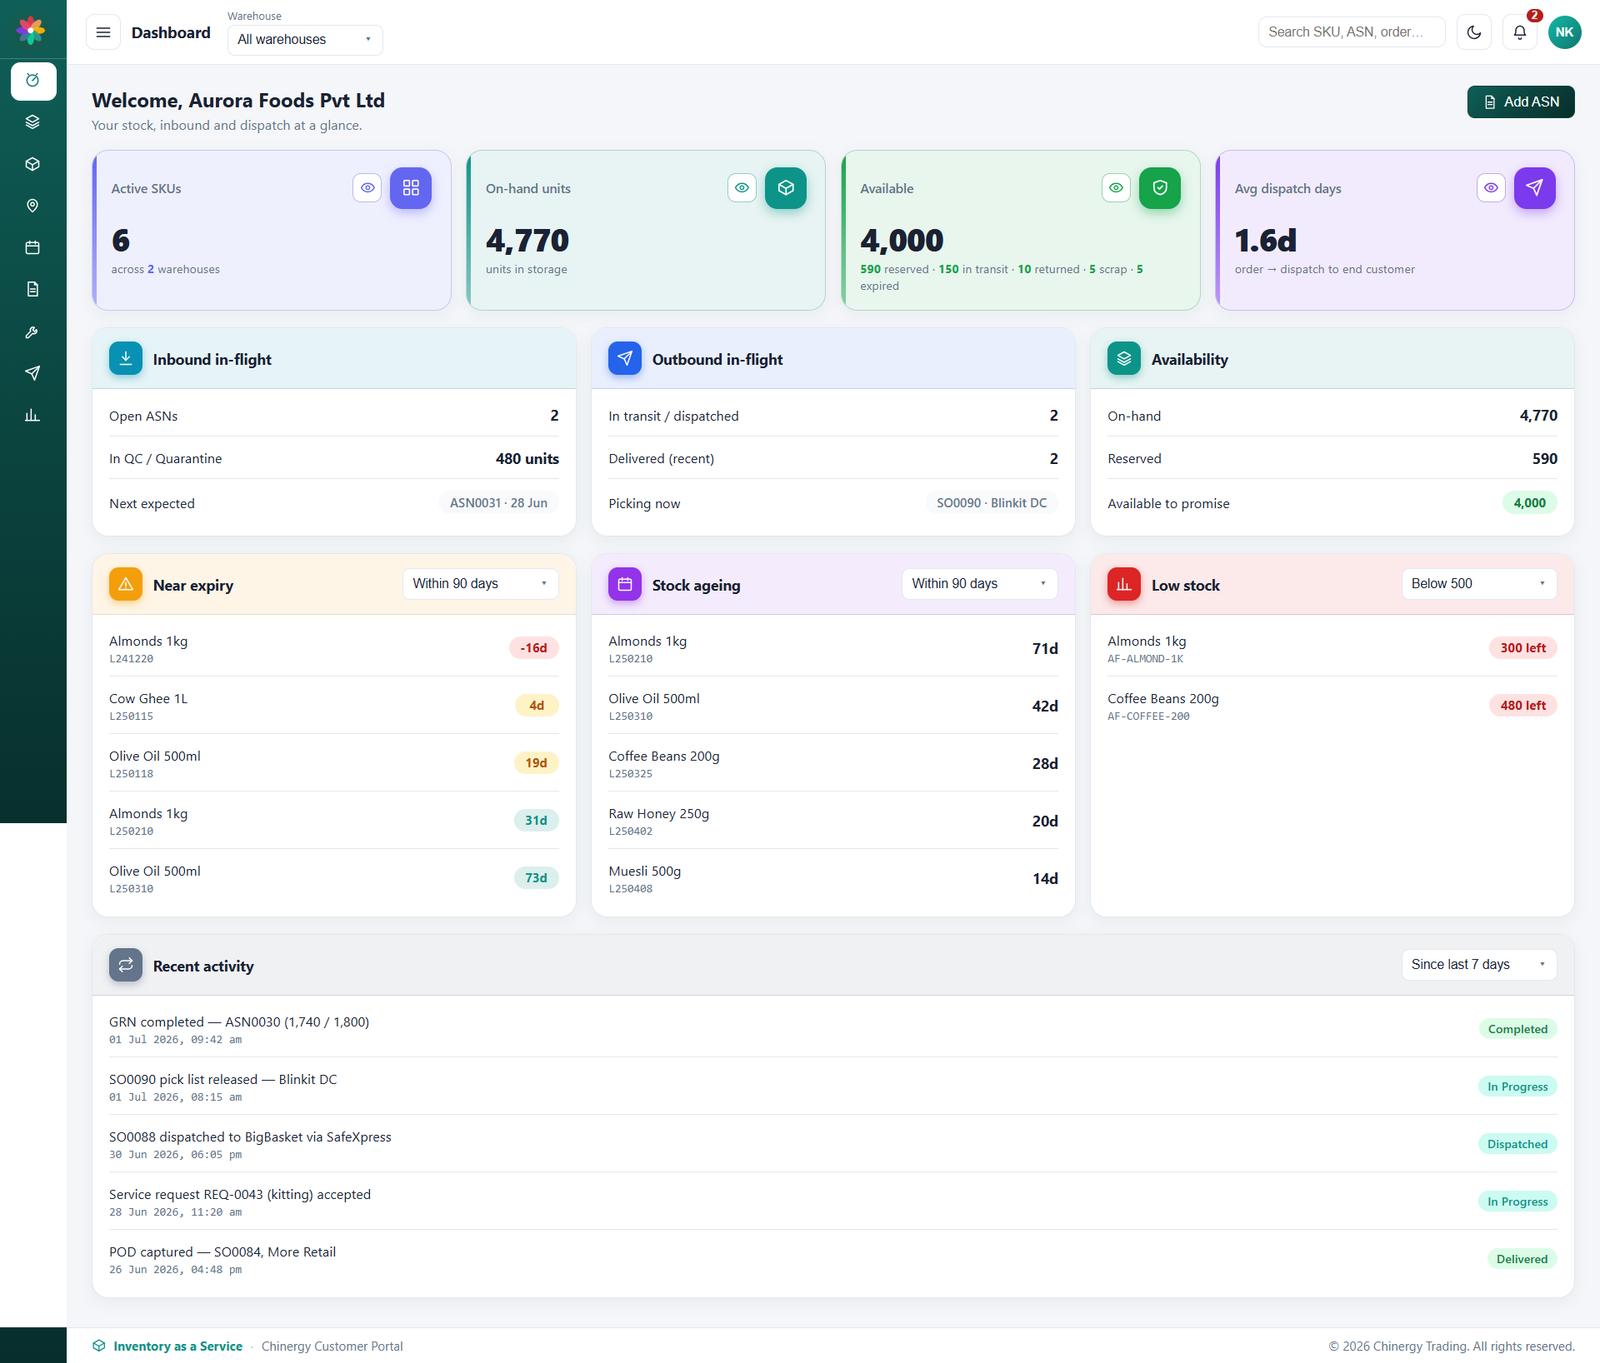
  • Their dashboard, stock, stock master, warehouse locations, ageing & expiry, inbound ASN, service requests, dispatch tracking and reports — nothing belonging to anyone else.

Transactions — the daily flow

IaaS transactions
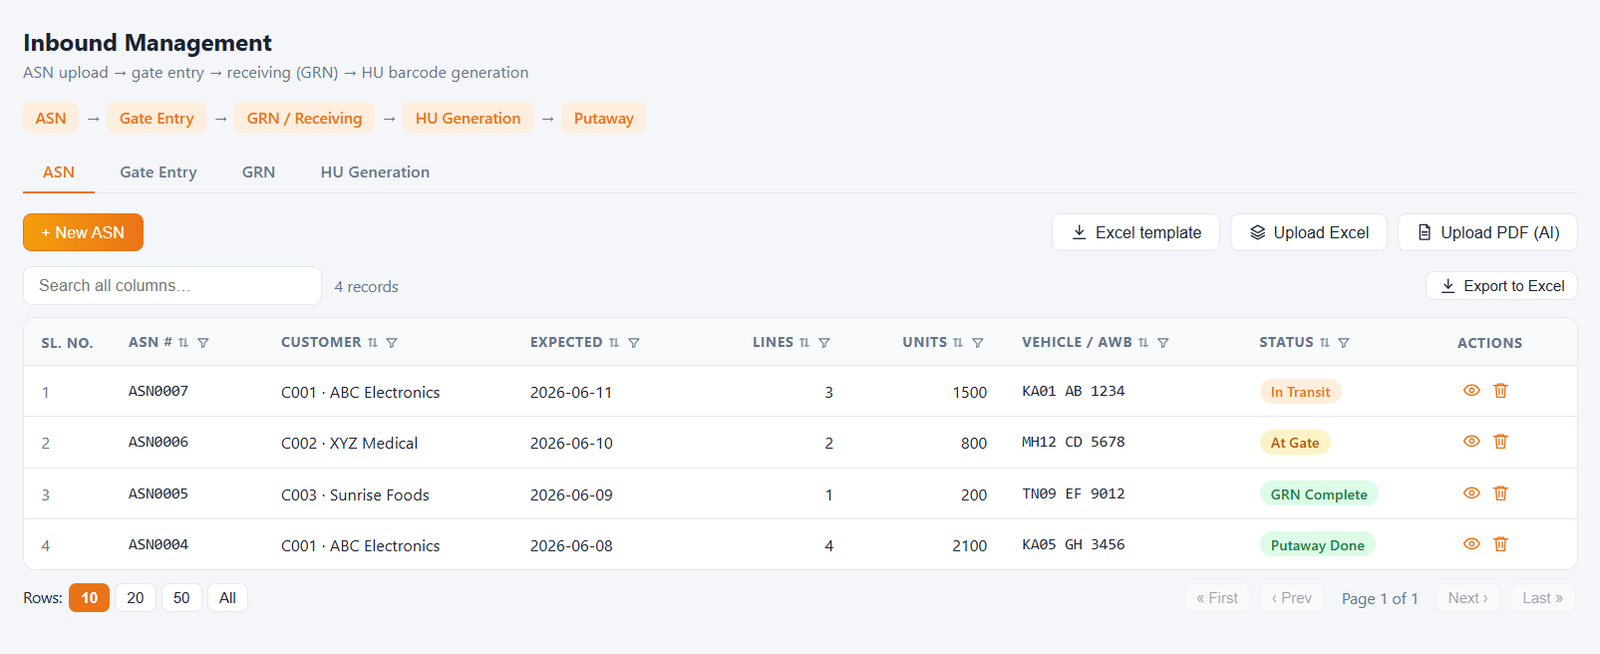
  • Inbound ASN/GRN, putaway, QC & holds, internal movement, break bulk, kitting, sales orders, picking, packing, dispatch, delivery challan, POD and returns — each barcode-driven and ledger-logged.

Why IaaS

The stock in your warehouse is your customers' business on your shelves — too important to run on memory and spreadsheets. IaaS gives you one clear, live view of every item you hold, moves it with barcode discipline, bills it automatically, and lets your customers watch it all happen. Fewer errors, faster turnarounds, automatic billing and self-served customers — all from one simple, secure platform.
Case Study · Ed Tech & Productivity

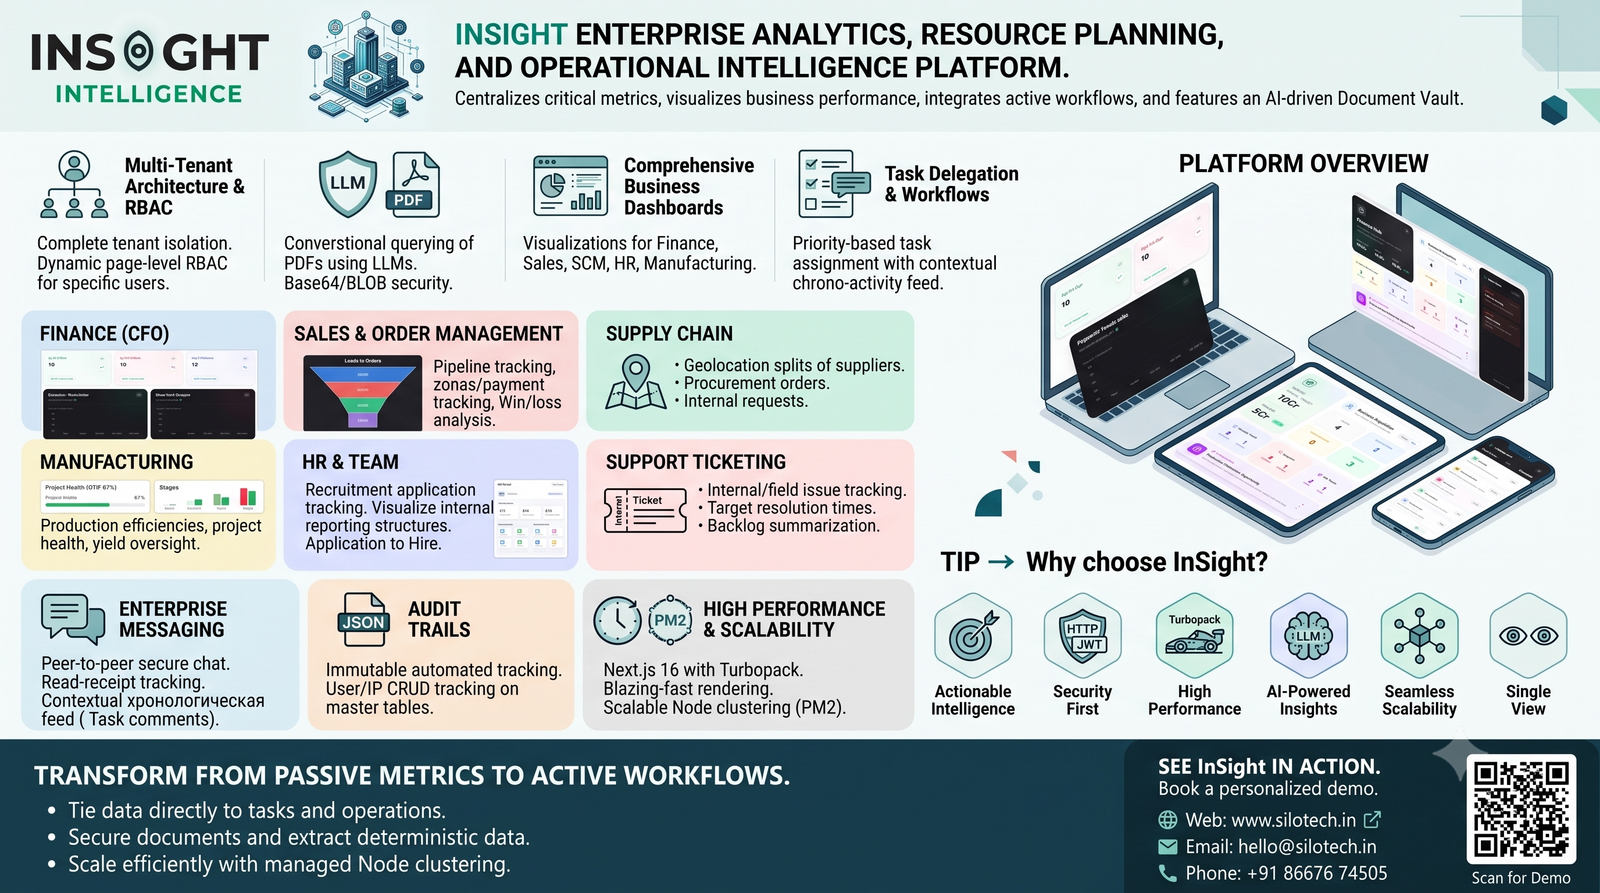
InSight — Enterprise Resource Planning & Operational Intelligence

Unify your data, automate your workflows, and unlock AI-driven insights — all in one secure platform.

Click the image to view it full-screen — scroll to zoom

Overview

InSight centralizes and visualizes critical business metrics across your entire organization — from Finance and Sales to Manufacturing, HR, and Supply Chain. But it doesn't stop at passive dashboards. InSight integrates active workflows, task delegation, and a secure AI document vault that reads and summarizes complex enterprise data, turning raw information into immediate action.

The Problem We Solve

Siloed departments, scattered data, and disconnected communication lead to delayed decisions and operational bottlenecks. Usually, getting a clear picture requires jumping between half a dozen different software tools. InSight brings everything into a single, unified view. It gives leaders a live picture of company health while providing teams the collaborative tools they need to execute seamlessly.

What InSight Does for You

  • See your entire company’s performance across all departments live, from one place.
  • Track operations in real-time, including sales pipelines, financial health, and supply chain logistics.
  • Assign tasks, track issues, and chat securely with your team directly within the platform.
  • Upload complex documents and let our AI instantly extract the exact insights you need.
  • Control exactly who sees what with dynamic, role-based access for every user.
  • Use it anywhere on a highly secure, multi-tenant architecture designed for scale.

Move Beyond Passive Metrics

InSight does more than just show you charts — it helps you manage the work directly linked to that data, so your team can act instantly instead of just observing.

  • Task Delegation — Assign priorities and deadlines linked directly to specific projects or opportunities.
  • Full Pipeline Visibility — Spot bottlenecks in sales, HR, or manufacturing before they impact the bottom line.
  • Secure Enterprise Chat — Discuss metrics, collaborate on tasks, and resolve support tickets without leaving the application.

Plan and Track Operations

  • Supply Chain Mastery — Oversee the complete lifecycle of procurement, inventory orders, and internal purchase authorizations.
  • Immutable Audit Trails — Keep a complete history of every login and system action for total accountability and compliance.
  • HR Funnels — Track HR pipelines visually, from initial application screening to the final job offer.

The Benefits

  • Faster, data-driven decision-making across all levels of the business.
  • Fewer disconnected tools — everything from enterprise chat to financial tracking in one unified hub.
  • Total data security and compliance with rigorous role-based access and audit logs.
  • Massive time savings by using AI to instantly parse and query lengthy enterprise PDFs.
  • One simple, clear view of your entire organization’s health.

Other Handy Features

  • Visual Hierarchy Nodes that map out your company's reporting structure interactively.
  • Instant alerts and status tracking for support tickets and active sales opportunities.
  • Aging buckets for Finance (30/60/90+ days) to help keep cash flow healthy and predictable.
  • Highly secure Document Vault that protects your proprietary data while utilizing advanced LLMs.
  • Customized Role Access — arrange permissions and screens dynamically based on employee roles.

Where InSight Helps

  • Finance Teams — Tracks cash flow, profit margins, and aging receivables/payables in real-time.
  • Sales & Marketing — Manages the entire pipeline from lead to fulfilled order, tracking win/loss metrics and opportunity statuses.
  • Supply Chain & Procurement — Monitors supplier geolocation, outstanding payments, and inventory orders to prevent stockouts.
  • Manufacturing — Highlights production efficiencies, project health (On Track, Delayed, Critical), and yield metrics.
  • HR Departments — Manages the recruitment funnel visually and maintains the internal organizational structure.
  • Field Support & IT — Centralizes ticketing, tracks resolution speeds, and identifies critical blockers instantly.

A Smarter, More Efficient Business

Every time your team finds an answer instantly using the AI Vault instead of reading a 100-page PDF, you save hours of labor. By centralizing operations, InSight reduces software overhead, accelerates communication, and turns raw data into a measurable strategic advantage.

What You Will See On Screen

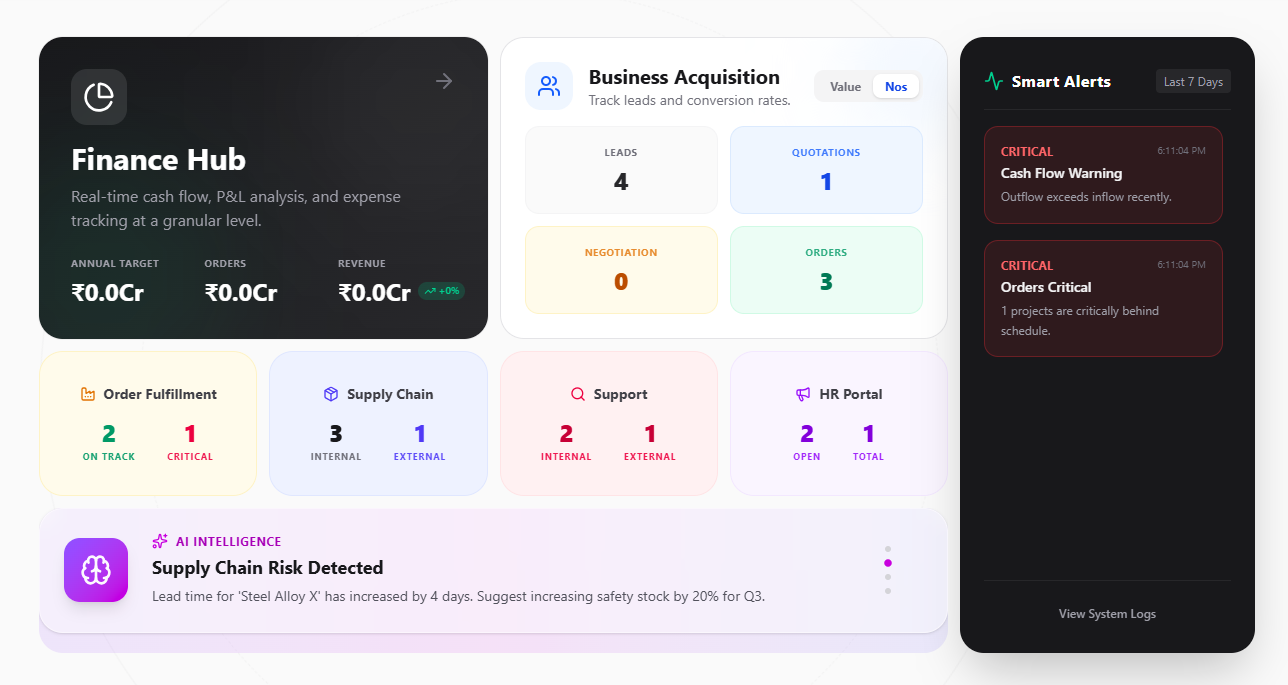
Main Executive Dashboard — your whole business at a glance

InSight executive dashboard
  • Top-level financial metrics, sales pipelines, and active support tickets.
  • Interactive charts and robust data tables sorting massive amounts of organizational data instantly.

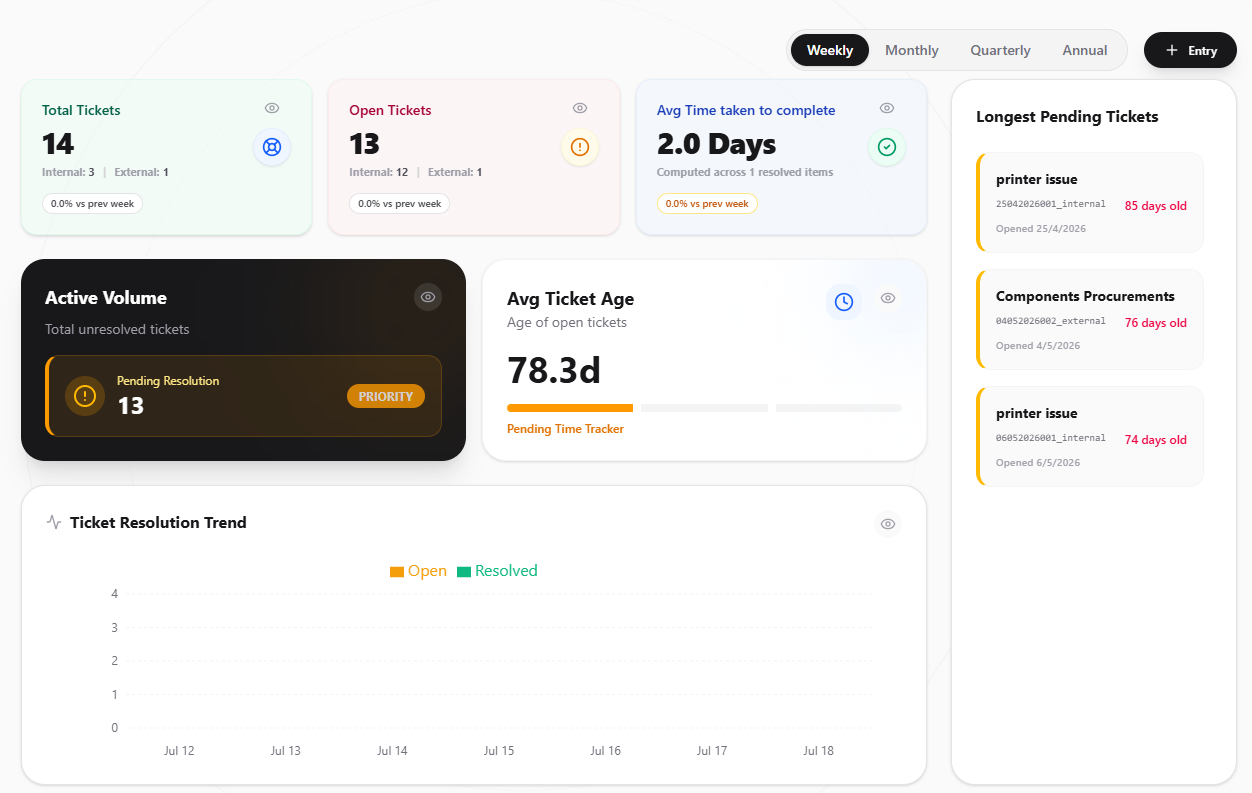
Department-Specific Dashboards — a closer look at operations

InSight department dashboards
  • Visual directed graphs (DAGs) for organizational hierarchy and workflow routing.
  • Task boards and secure chat windows tied directly to specific projects, orders, or tickets.

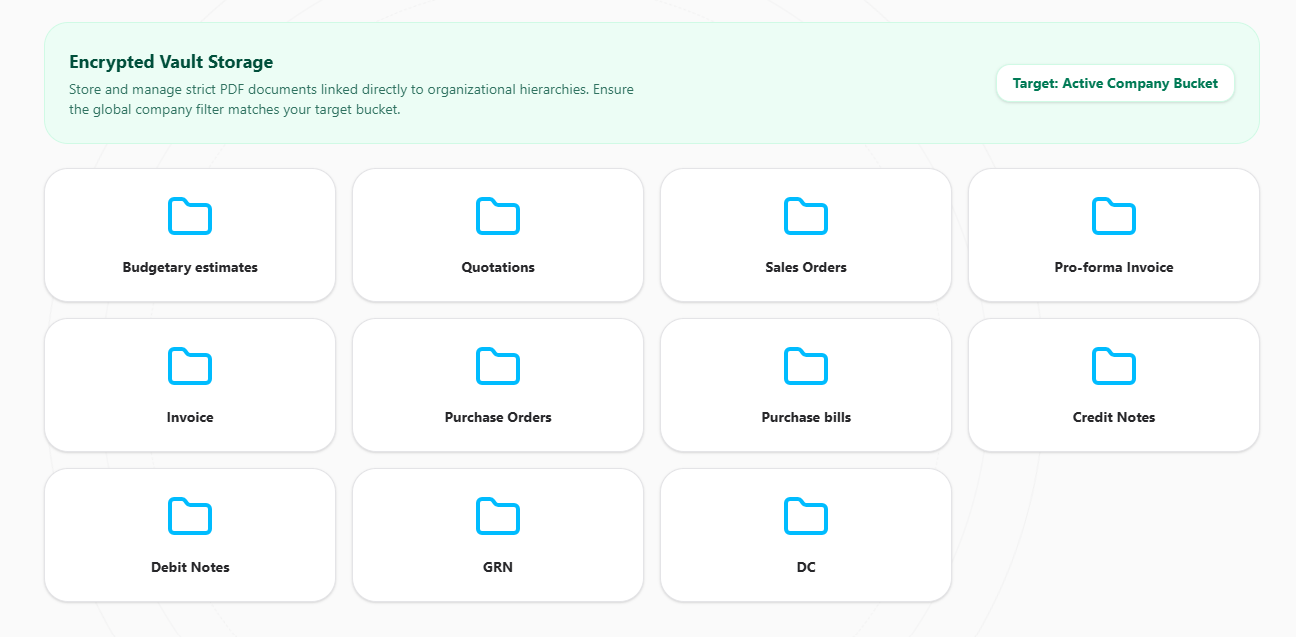
The AI Vault

InSight AI Vault
  • A secure, conversational interface where you can upload enterprise documents and ask direct questions to extract targeted data.

Case Study · Ed Tech & Productivity

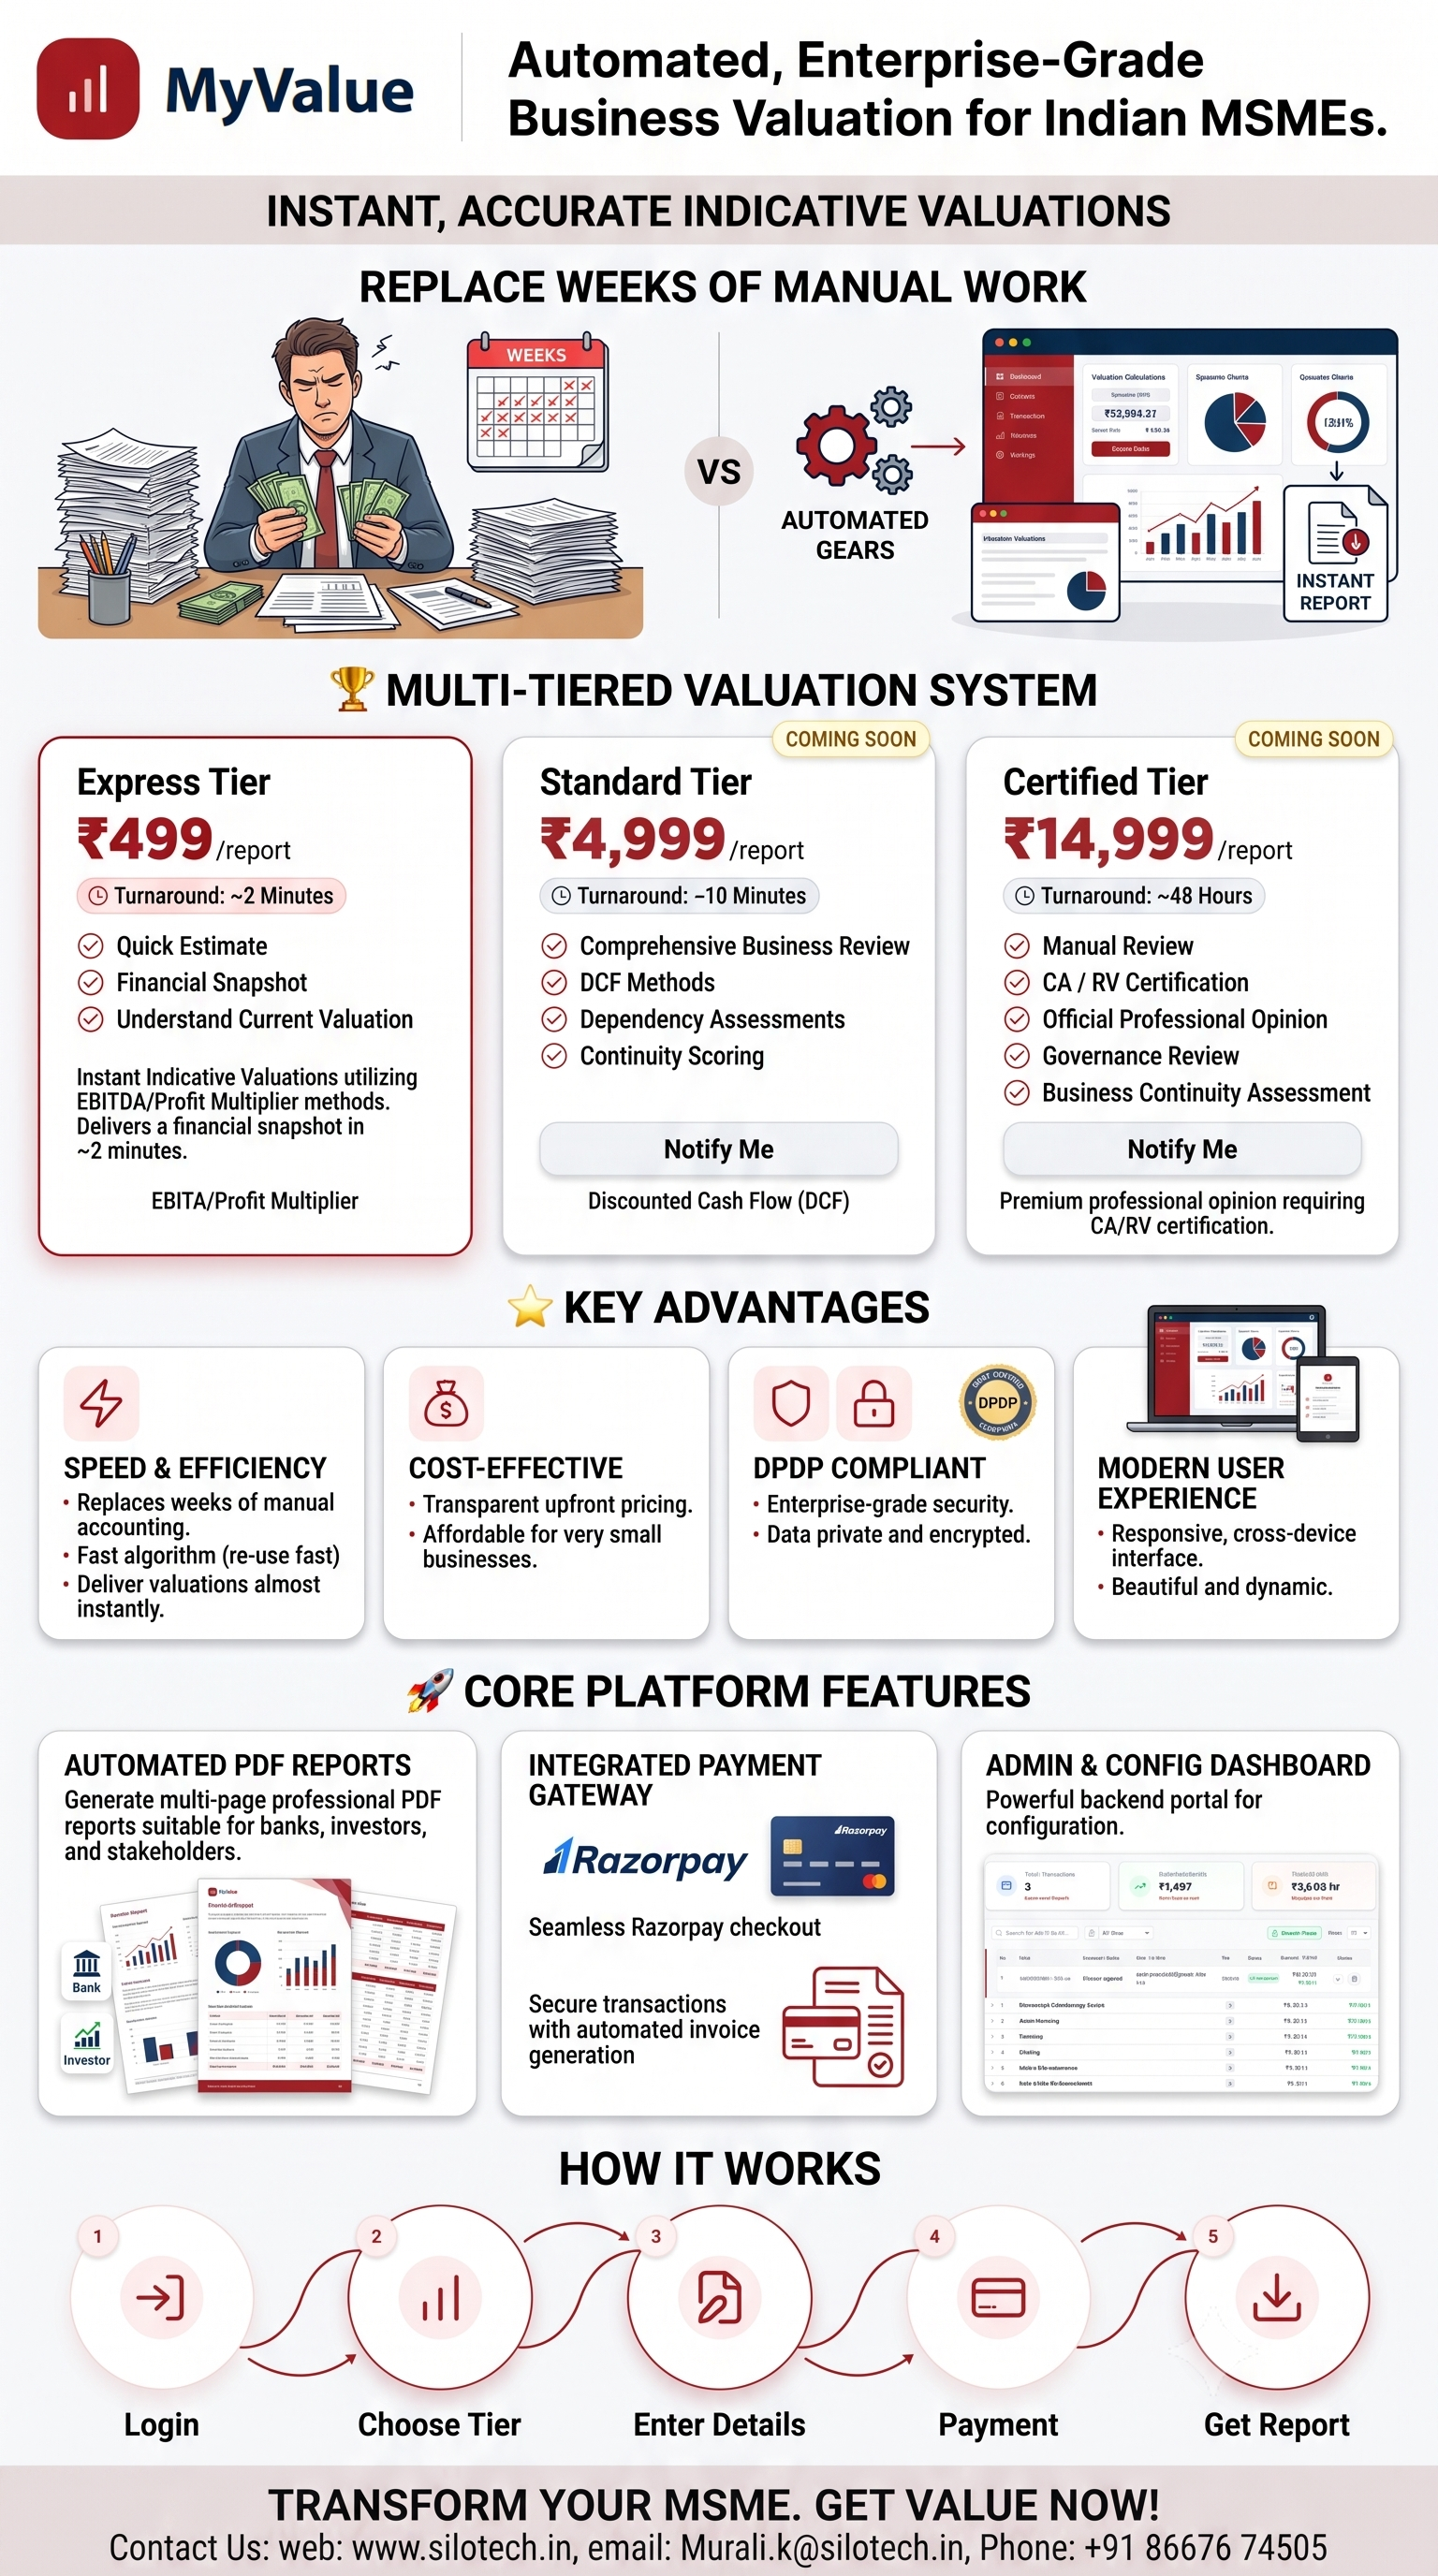
MyValue — Business Valuation for MSMEs

Fast, clear, and professional business valuations for MSMEs.

Click the image to view it full-screen — scroll to zoom

Overview

MyValue simplifies the complex world of business valuation for Micro, Small, and Medium Enterprises (MSMEs) in India. It provides business owners, lenders, and advisors with instant, highly accurate indicative valuations using industry-standard financial models. Whether for securing a loan, attracting investment, or internal planning, MyValue delivers a professionally formatted report in minutes, entirely online.

The Problem We Solve

Traditional business valuations are expensive, time-consuming, and require extensive back-and-forth with financial professionals. For a small business owner needing a quick baseline for a loan application or equity discussion, the traditional weeks-long process is a major roadblock. MyValue eliminates this friction by instantly generating dependable valuation reports at a fraction of the cost.

What MyValue Does for You

  • Get an indicative business valuation in minutes, not weeks.
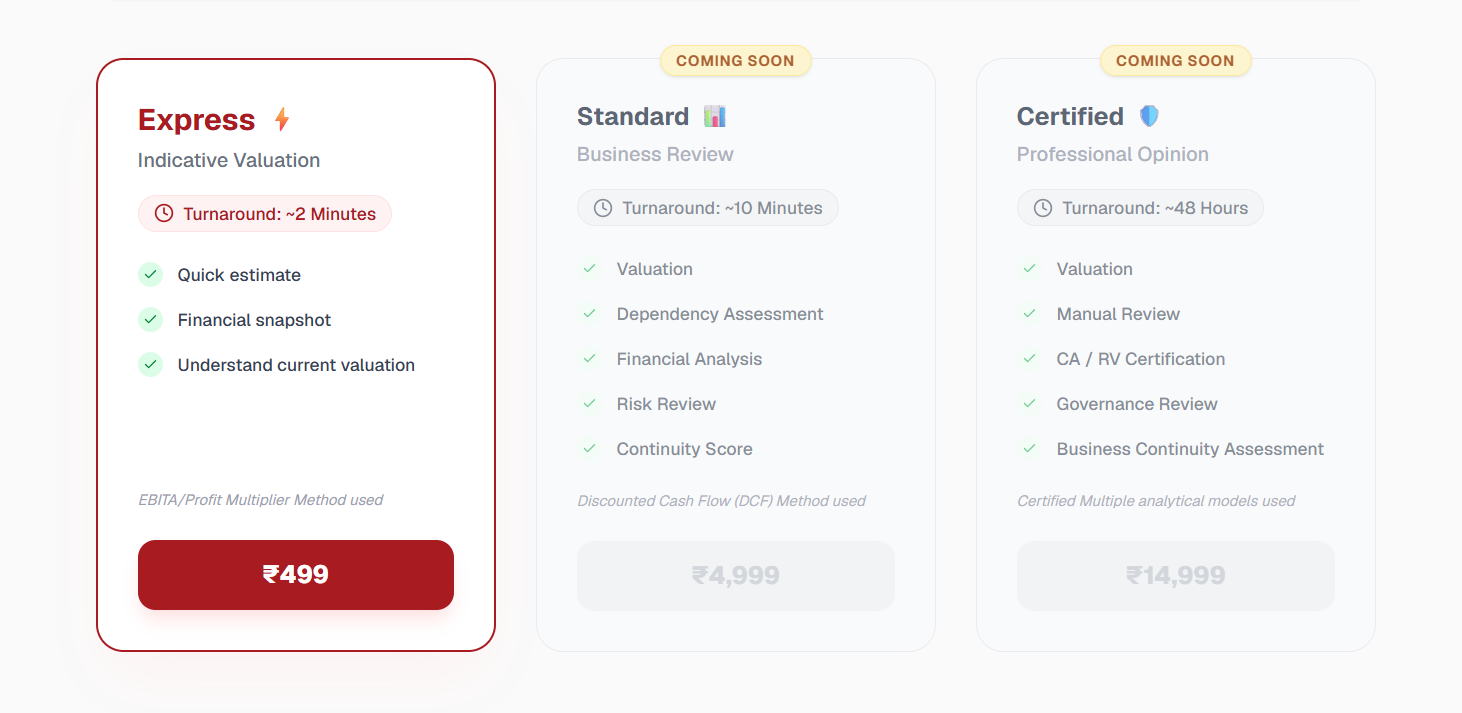
  • Choose the level of detail you need — from quick estimates to certified professional opinions.
  • Instantly generate beautifully formatted PDF reports ready for lenders or investors.
  • Understand exactly how your business is valued using transparent methods like DCF and EBITDA Multipliers.
  • Access your financial snapshot and reports securely from any device.

Understand Your Worth Before You Negotiate

MyValue does more than just give you a number — it helps you understand the drivers behind your business’s value, empowering you during crucial financial discussions.

  • Actionable insights — see exactly how your revenue, EBITDA, and industry multipliers affect your worth.
  • Scenario planning — test different growth assumptions before pitching to investors.
  • Professional credibility — walk into a bank or board meeting with a standardized, data-backed report.

Plan and Track Your Growth

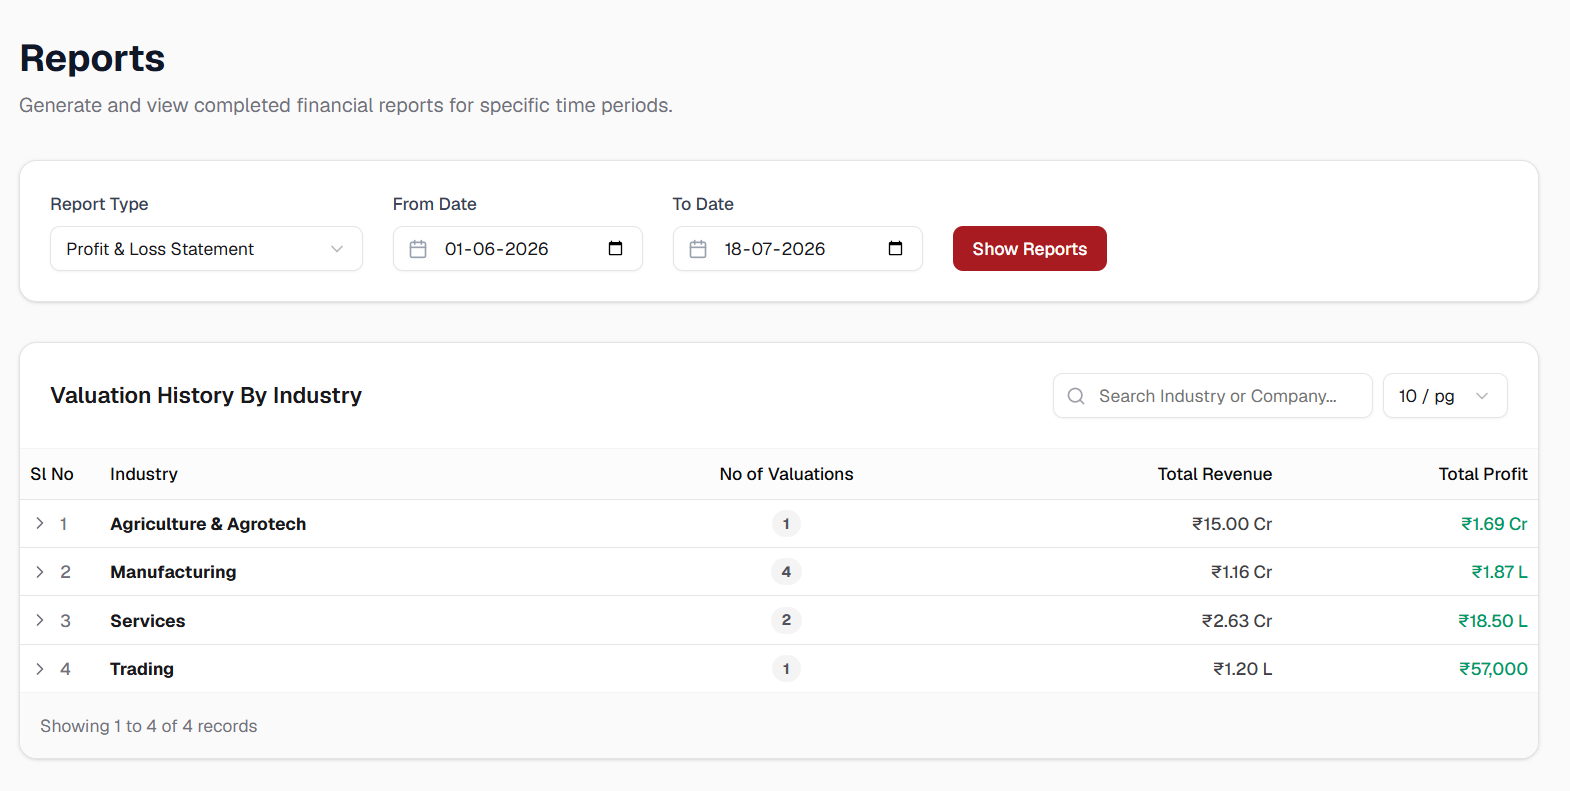
  • Keep a secure, centralized history of your valuation reports over time.
  • Access previous reports and download invoices instantly through your private dashboard.
  • Seamlessly transition from a quick Express valuation to a comprehensive Certified review as your business scales.

The Benefits

  • Faster loan approvals and investment discussions with ready-made documentation.
  • Significantly lower costs compared to traditional offline valuation services.
  • Complete transparency — know exactly which financial models were used.
  • Enterprise-grade security and DPDP compliance for your sensitive financial data.
  • One simple platform for all your business valuation needs.

Other Handy Features

  • Instant, secure payment processing via Razorpay.
  • Tiered pricing that fits your exact needs (Express, Standard, Certified).
  • Automated industry-specific risk and multiplier adjustments.
  • Dedicated admin portal for configuring global financial assumptions and multipliers.
  • Secure, role-based access to ensure data privacy.

Where MyValue Helps

  • Securing Bank Loans — provides lenders with a clear, standardized snapshot of your business’s financial health and indicative worth.
  • Equity Investments & M&A — gives founders a realistic starting point for negotiating with angel investors, VCs, or potential acquirers.
  • Internal Strategic Planning — helps management teams track business value growth year-over-year.
  • CA & Advisory Firms — allows financial professionals to generate rapid baseline reports for their MSME clients before conducting deep-dive manual reviews.
  • Business Restructuring — assists in establishing baseline values during partner buyouts or corporate restructuring.

A Stronger Bottom Line

Every time you use MyValue instead of an expensive offline consultancy for a baseline valuation, you save significant time and capital. MyValue puts those savings back into your business, delivering professional financial clarity at a transparent, upfront price.

What You Will See On Screen

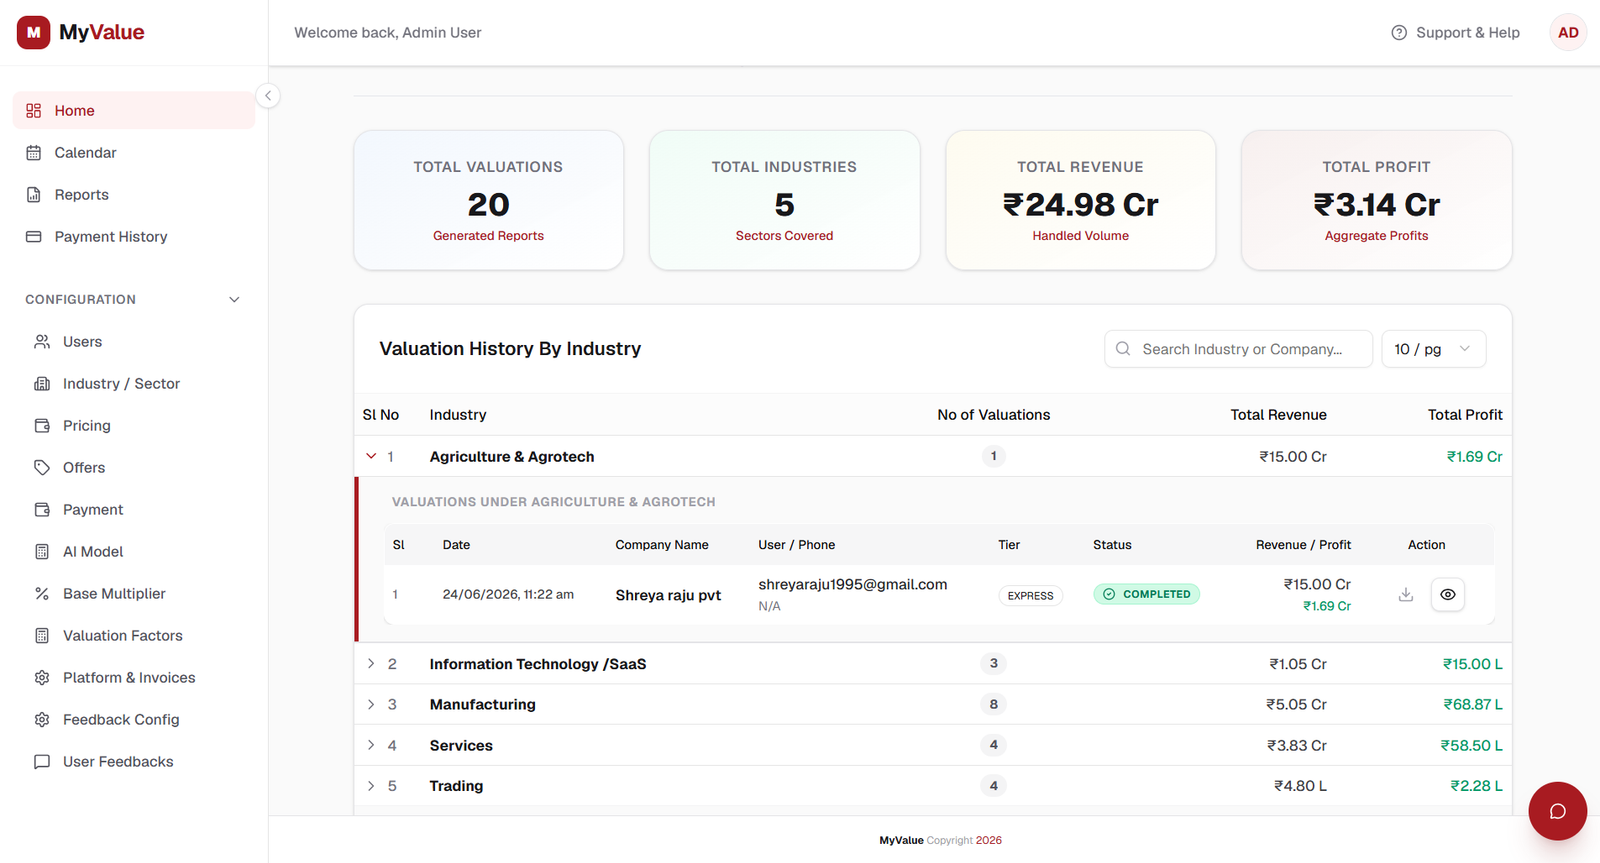
Main Dashboard — your valuation history at a glance

MyValue main dashboard

Recent reports, invoice downloads, and quick links to start a new valuation.

Dynamic Input Forms

MyValue input forms

Clean, step-by-step financial input screens tailored to your industry and growth stage.

Report Preview

MyValue report preview

A real-time, beautifully formatted PDF report featuring financial tables, valuation breakdowns, and dependency assessments.

Why MyValue

Understanding your business’s worth is too important to be complicated, slow, or prohibitively expensive. MyValue gives you a fast, clear, and professional view of your enterprise’s value — empowering you to act with confidence. Faster insights, lower costs, professional formatting, and real, measurable financial clarity — all from one simple, secure platform.
Case Study · Ed Tech & Productivity

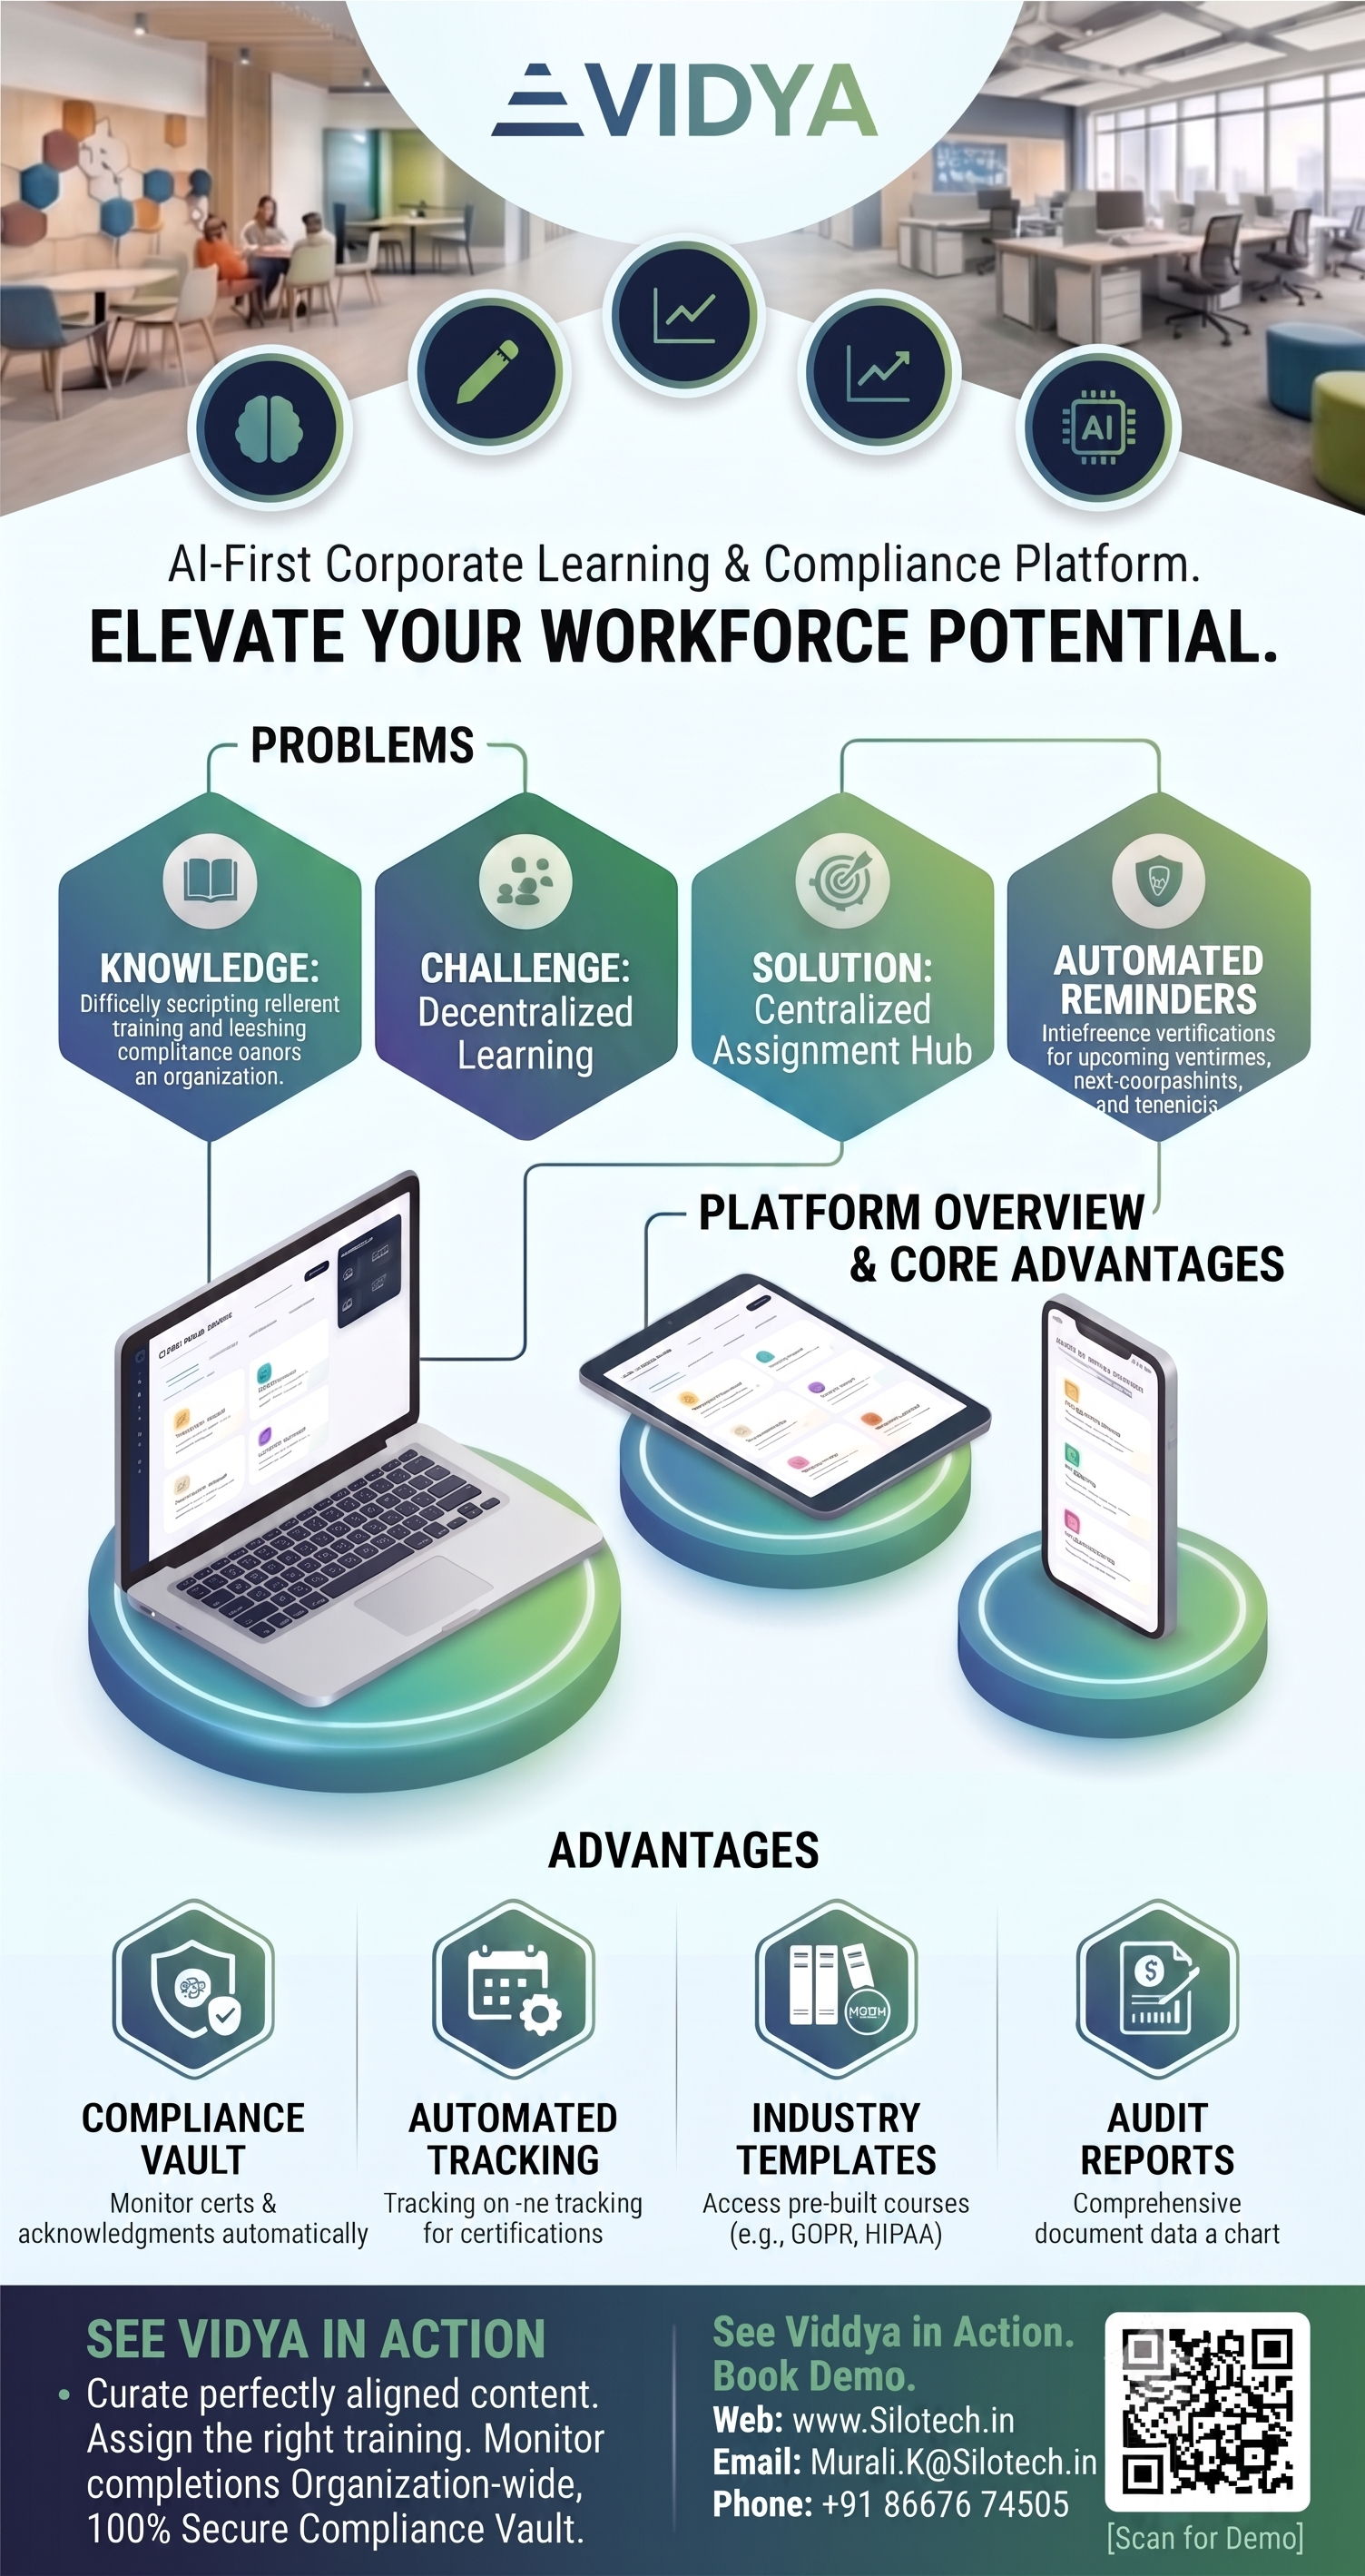
3Vidya — AI-Powered Learning & Mentorship Platform

Elevate your workforce with personalized AI coaching, expert mentorship, and seamless compliance tracking — all in one place.

Click the image to view it full-screen — scroll to zoom

Overview

3Vidya keeps your employees learning, compliant, and growing. It provides a centralized hub for interactive AI coaching, subject-matter mentorship, and seamless course delivery. With real-time dashboards for both learners and administrators, it ensures that your team is always developing the skills they need. The moment a new policy needs signing or a skill gap appears, 3Vidya gives you the tools to address it instantly.

The Problem We Solve

Corporate training is often static, untracked, and one-size-fits-all. Employees struggle to find mentors, and admins spend hours tracking compliance and creating training materials. 3Vidya brings everything into a single, dynamic ecosystem. Instead of passive videos, employees get active AI roleplay and instant feedback, while admins get clear visibility into organizational progress and compliance readiness.

What 3Vidya Does for You

  • See all employee progress and compliance stats live, from one central dashboard.
  • Provide 24/7 AI-powered coaching for language, complex concepts, and conversational roleplaying.
  • Connect employees with internal experts through a built-in Mentors Hub and booking system.
  • Generate comprehensive training content instantly using our AI Content Assistant.
  • Manage multi-tenant organizations, user roles, and departmental hierarchies effortlessly.
  • Use it anywhere — fully responsive on computer, tablet, or phone.

Master Skills Before They Matter

3Vidya does more than host courses — it helps your team practice and refine their skills in a safe environment, so they are ready when it counts.

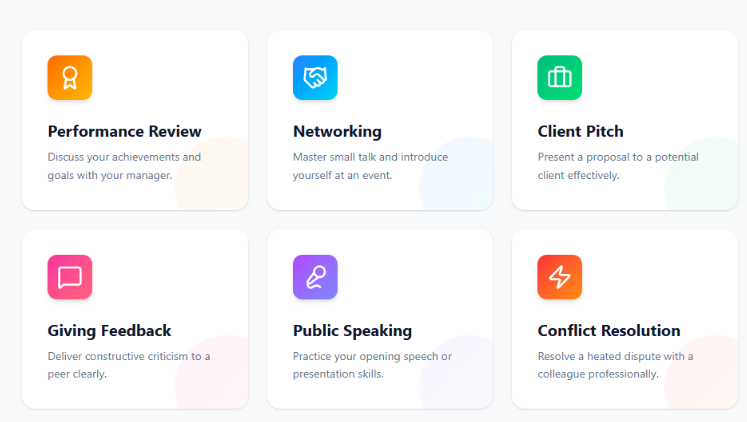
  • Voice-First Interaction — Practice pitches and difficult conversations hands-free. The AI listens, detects silence, auto-sends, and replies with realistic voice feedback.
  • Roleplay Scenarios — Rehearse performance reviews, client pitches, and support calls with a responsive AI avatar.
  • Concept Breakdown — Let the AI simplify complex theories so employees master new topics faster.

Manage Learning and Compliance

  • Automated Compliance Tracking — Ensure mandatory policies (like NDAs or safety manuals) are reviewed and digitally signed, with built-in tracking.
  • Hierarchy Visibility — Managers get a clear view of their direct reports’ progress, quiz scores, and learning hours.
  • AI Content Generation — Create full policy documents, user manuals, and multi-chapter courses with a single click, ready for admin approval.

The Benefits

  • Higher employee engagement through interactive AI and human mentorship.
  • Less time spent on manual content creation and compliance tracking.
  • Clear visibility into organizational skill development and readiness.
  • Lower training costs by utilizing AI coaches for routine skill reinforcement.
  • One simple platform for learning, coaching, and policy management.
  • Safe, secure, and easy for anyone to use, with robust role-based access control.

Other Handy Features

  • Health at a glance — Quick dashboard stats showing assigned courses, completed courses, learning hours, and pending policies.
  • SaaS Multi-Tenancy — Customizable subscription plans, limits, and branding per company.
  • Smart Mic Technology — Visual pulsing indicators and auto-send on silence for a seamless AI chat experience.
  • Custom Admin Workflows — A rich markdown preview allowing admins to edit and approve AI-generated content before publishing.
  • Token & API Management — Track AI cost, token limits, and API usage transparently.

Where 3Vidya Helps

  • Corporate Onboarding — Streamlines new hire training and ensures all day-one compliance documents are signed and tracked.
  • Sales Training — Uses AI roleplay to help sales teams practice pitches, handle objections, and refine their delivery.
  • Leadership Development — Connects emerging leaders with experienced mentors across the organization via seamless calendar bookings.
  • Technical Skill Building — Helps employees decode technical manuals and complex architectures with the AI Concept Coach.
  • HR & Compliance — Generates policy documents instantly and ensures 100% audit-ready compliance tracking across the workforce.
  • Customer Support — Allows agents to practice difficult customer conversations in a safe, AI-driven environment before facing real clients.

A Smarter Bottom Line

Every time an employee uses the AI coach instead of requiring external training or seminars, you save time and budget. 3Vidya tracks learning hours, course completions, and AI engagement, giving you a clear picture of your training ROI — for today, this month, and the entire year.

What You Will See On Screen

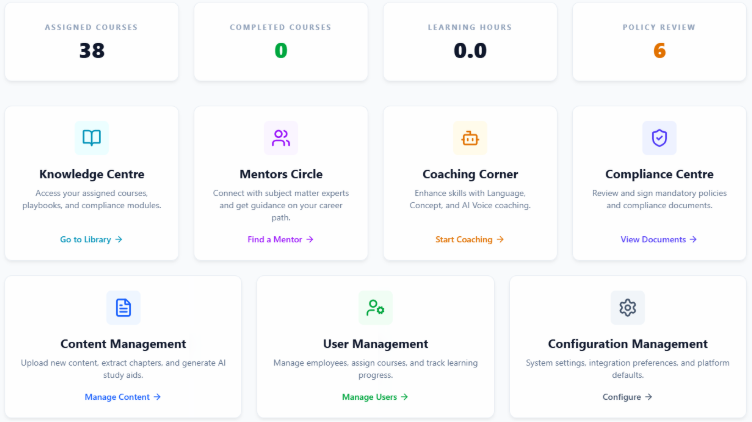
Learner Dashboard — your learning journey at a glance

3Vidya learner dashboard
  • Quick stats showing Assigned Courses, Completed Courses, Learning Hours, and Pending Policy reviews.
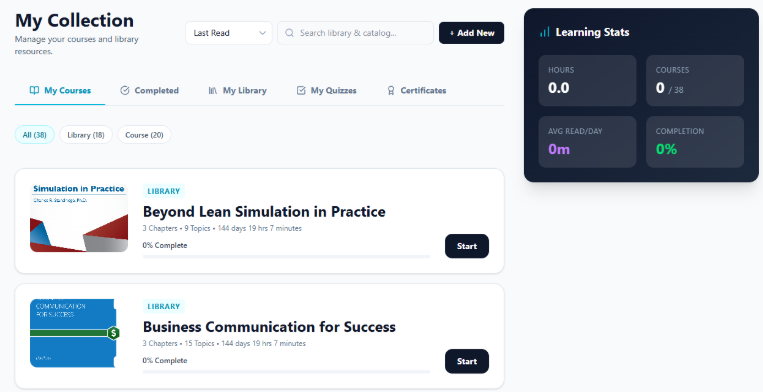
  • A “Continue Learning” feed that tracks your last active courses and lets you jump right back in.
  • One-click access to the Knowledge Centre, Mentors Circle, Coaching Corner, and Compliance Centre.

Admin Dashboard — a closer look at the organization

3Vidya admin dashboard
  • Super Admin Stats summarizing active companies, total users, token usage, and active mentors.
  • Content Management portal for uploading files, extracting chapters, and generating AI study aids.
  • User Management views to assign courses, manage hierarchies, and monitor compliance across departments.

Immersive Coaching Interface

3Vidya coaching interface

A sleek chat interface with a Smart Mic button that pulses red when listening and auto-sends when you pause.

Why 3Vidya

Your team’s growth is too important to leave to static slide decks and untracked manuals. 3Vidya gives you a single, clear view of your organization’s learning health — while empowering employees with next-generation AI coaching and human mentorship. Higher engagement, lower training costs, better compliance, and a smarter workforce — all from one simple, secure platform.
Case Study · Ed Tech & Productivity

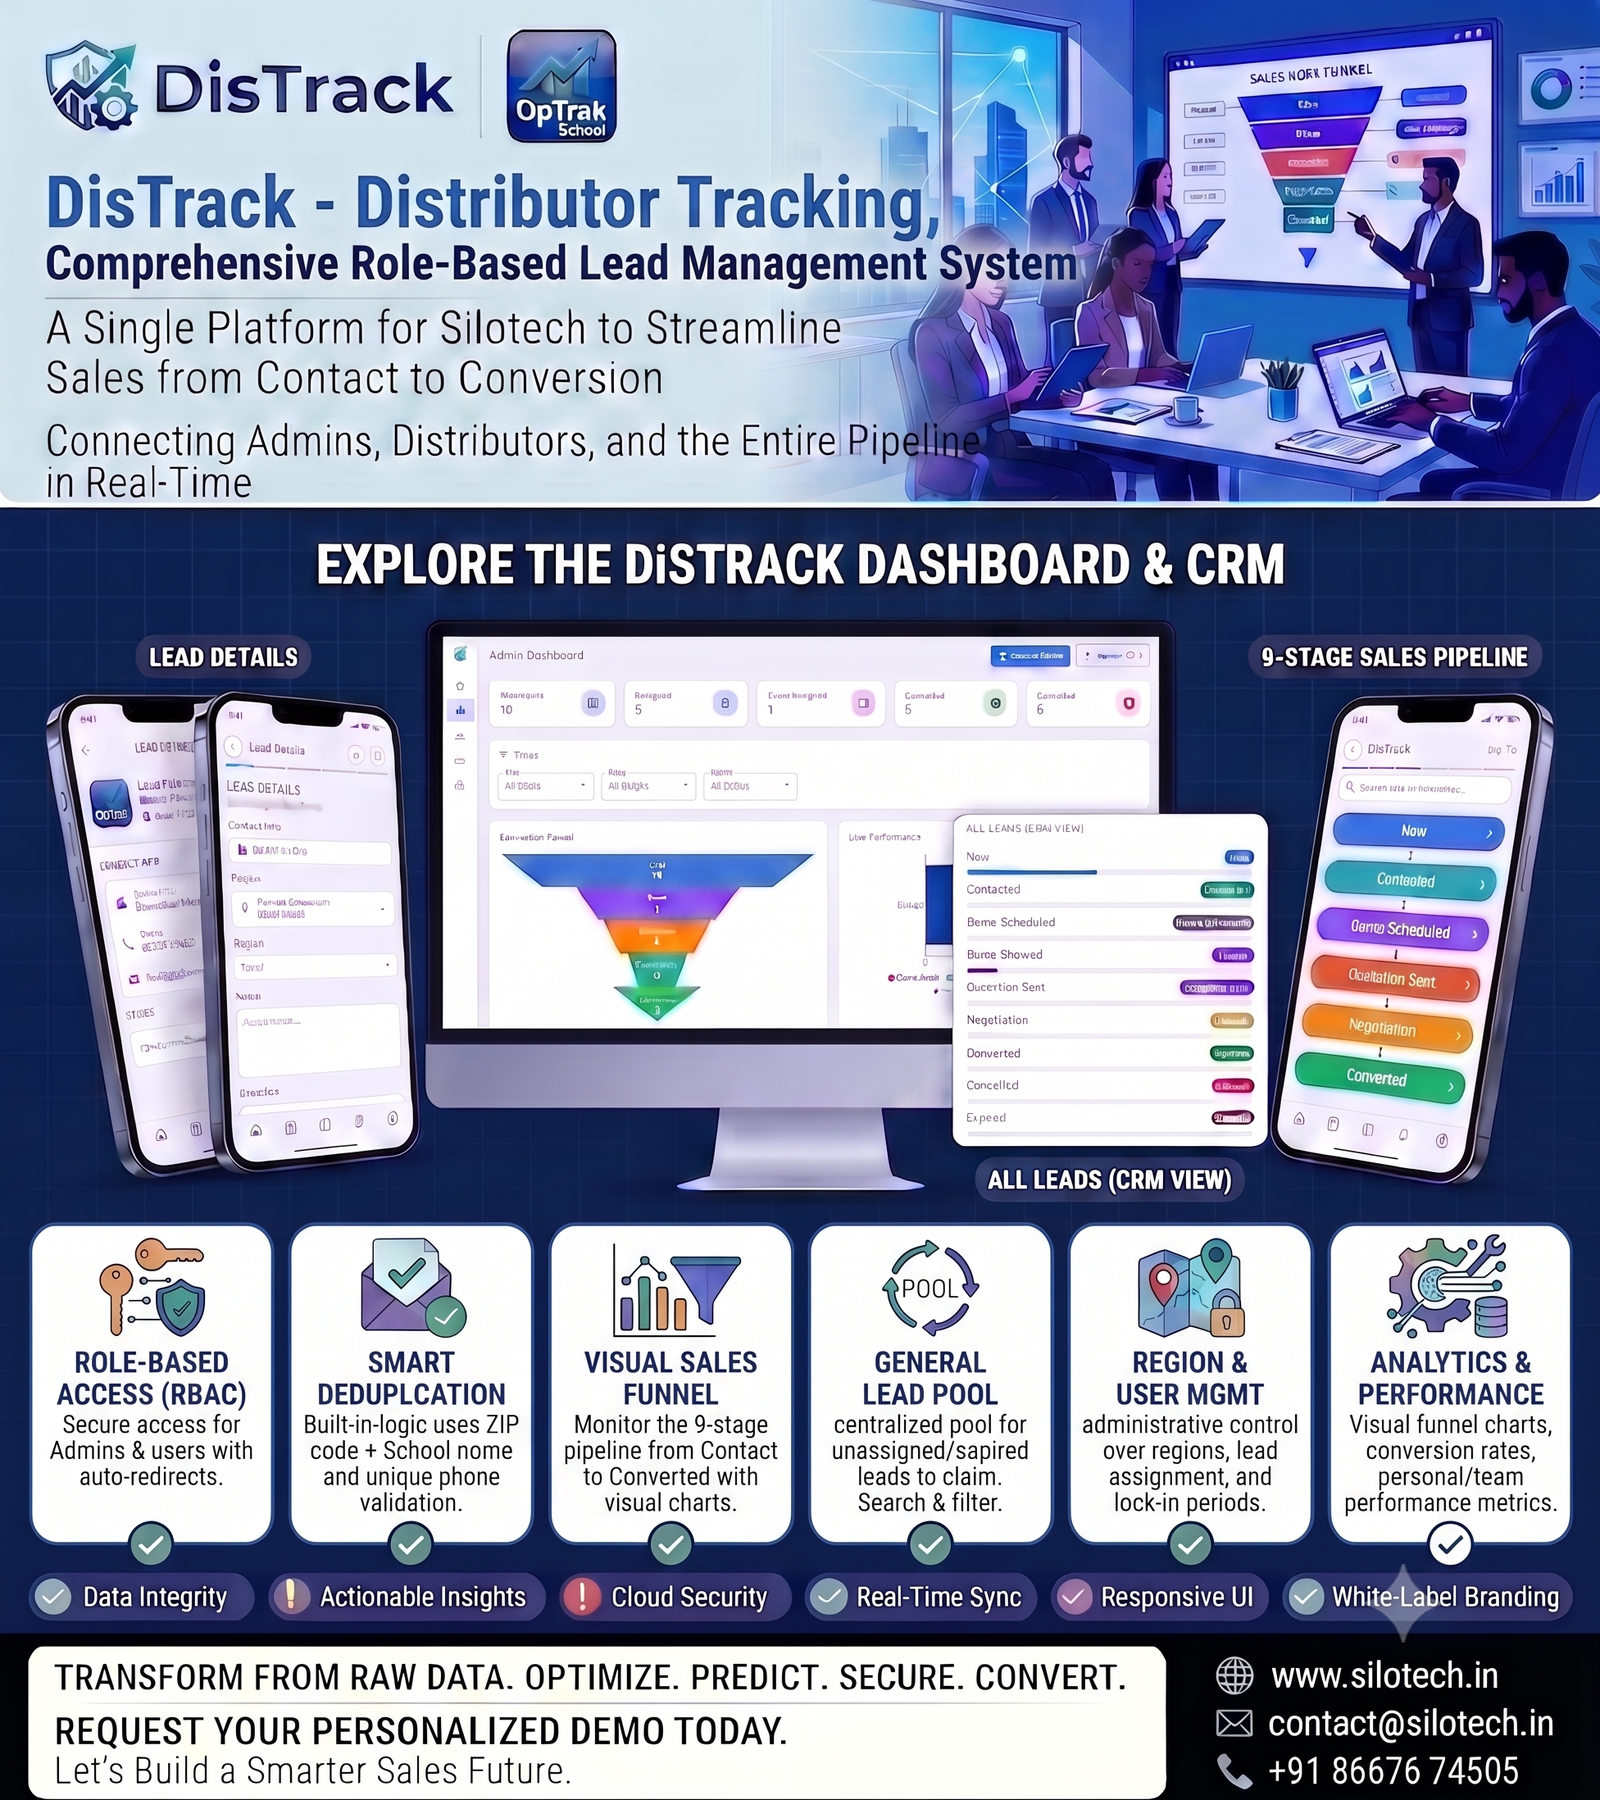
DisTrack — Distributor Tracking & Lead Management

Track every lead, empower every distributor, close every deal — in real time.

Click the image to view it full-screen — scroll to zoom

Overview

DisTrack keeps an eye on the sales pipeline that keeps your business growing — across all regions and distributors. It shows exactly where every lead stands in real time, from first contact to final conversion. The moment a lead stalls or expires, it warns you straight away, so you can reassign it before losing the opportunity.

The Problem We Solve

Leads in the field are often out of sight — until they go cold. By then, the result is usually a missed sale, a frustrated distributor, or wasted marketing effort. DisTrack gives teams a simple, live picture of how every lead is progressing across all of their regions, ensuring no prospect falls through the cracks.

What DisTrack Does for You

  • See all of your regions, distributors, and their leads live, from one place.
  • Get an instant view the moment a lead stalls or enters the general pool.
  • Spot duplicate leads early — before they cause confusion or duplicated effort.
  • See how your conversion rates are trending across the entire team.
  • Manage leads securely — tailored access and views for admins and distributors.
  • Use it effortlessly with a responsive, modern interface on any device.

Empower Your Sales Pipeline

DisTrack does more than tell you when a lead is lost — it helps you see pipeline bottlenecks, so your team can act proactively instead of reacting to missed targets.

  • Smart deduplication — flags identical schools or phone numbers well before effort is duplicated.
  • Auto-expiring leads — unworked leads are automatically moved back to the pool so someone else can close them.
  • Fewer lost opportunities — small delays in the pipeline are caught and addressed while the lead is still warm.

Plan and Track Leads

  • Move leads through a clear 9-stage pipeline, from “New” to “Converted”.
  • Keep a complete history for every lead — status changes, remarks, and updates in one place.
  • Hand over smoothly — when a lead is reassigned from the general pool, the full record stays with the prospect.

The Benefits

  • Fewer cold leads and fewer missed opportunities.
  • Fairer and faster lead distribution — and higher conversion rates.
  • Longer lead vitality — follow up at the right time based on pipeline stages.
  • Clearer performance metrics and a transparent sales story.
  • One simple view for your whole fleet of distributors.
  • Safe, secure and easy for anyone to use.

Other Handy Features

  • Pipeline at a glance — visual sales funnel to track exactly where leads are dropping off.
  • Smart routing — filter by region, so the right distributor sees the right leads.
  • Simple reports — Excel and CSV exports you can view, share or download in one click.
  • Automatic metrics — user performance and conversion rates tracked automatically.
  • Centralized pool — a general pool for expired or unassigned leads waiting to be claimed.
  • Your own dashboard — customized metrics based on whether you are an Admin or a Distributor.

Where DisTrack Helps

  • Regional Managers — watches the pipeline across every territory at once and highlights areas that need more support; cuts down on manual reporting and flags drops in activity.
  • Sales Admins — shows the health of the entire database, highlights under-performing distributors early, and tracks the overall conversion rates.
  • Distributors on the Ground — keeps a constant eye on their assigned leads, lets them update statuses easily, and plan follow-ups without administrative headaches.
  • Marketing Teams — monitors the lead pool and ensures that marketing efforts are actually being followed up on by the sales team.

A Stronger Bottom Line

Every time a lead is converted instead of going cold, you increase revenue and maximize your marketing ROI. DisTrack adds this up for you in plain numbers — showing conversion rates, active deals, and user performance for today and for the month.

What You Will See On Screen

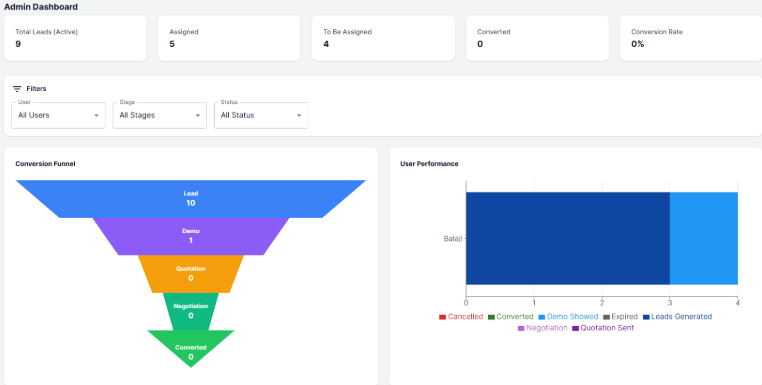
Main Dashboard — your whole pipeline at a glance

DisTrack main dashboard

Visual Sales Funnel and critical metric cards (Total Leads, Pending, Active, Converted, and Pool Leads), plus a user performance table with automatic conversion rate tracking.

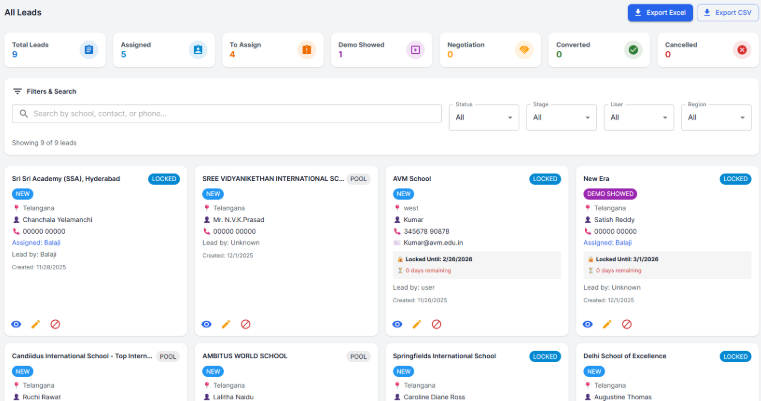
All Leads View — a closer look at your database

DisTrack all leads view

Searchable, filterable card grid layout with color-coded status chips and instant export capabilities.

General Pool — the safety net

DisTrack general pool

A clear view of unassigned or expired leads waiting to be claimed by active distributors.

Why DisTrack

The leads that keep your business growing are too important to leave unseen. DisTrack gives you a single, clear view of the health of every prospect you depend on — and empowers your team to act in time. Fewer lost deals, higher conversions, fairer distribution, and a real, measurable boost in sales efficiency — all from one simple, secure platform.
Case Study · Med Tech

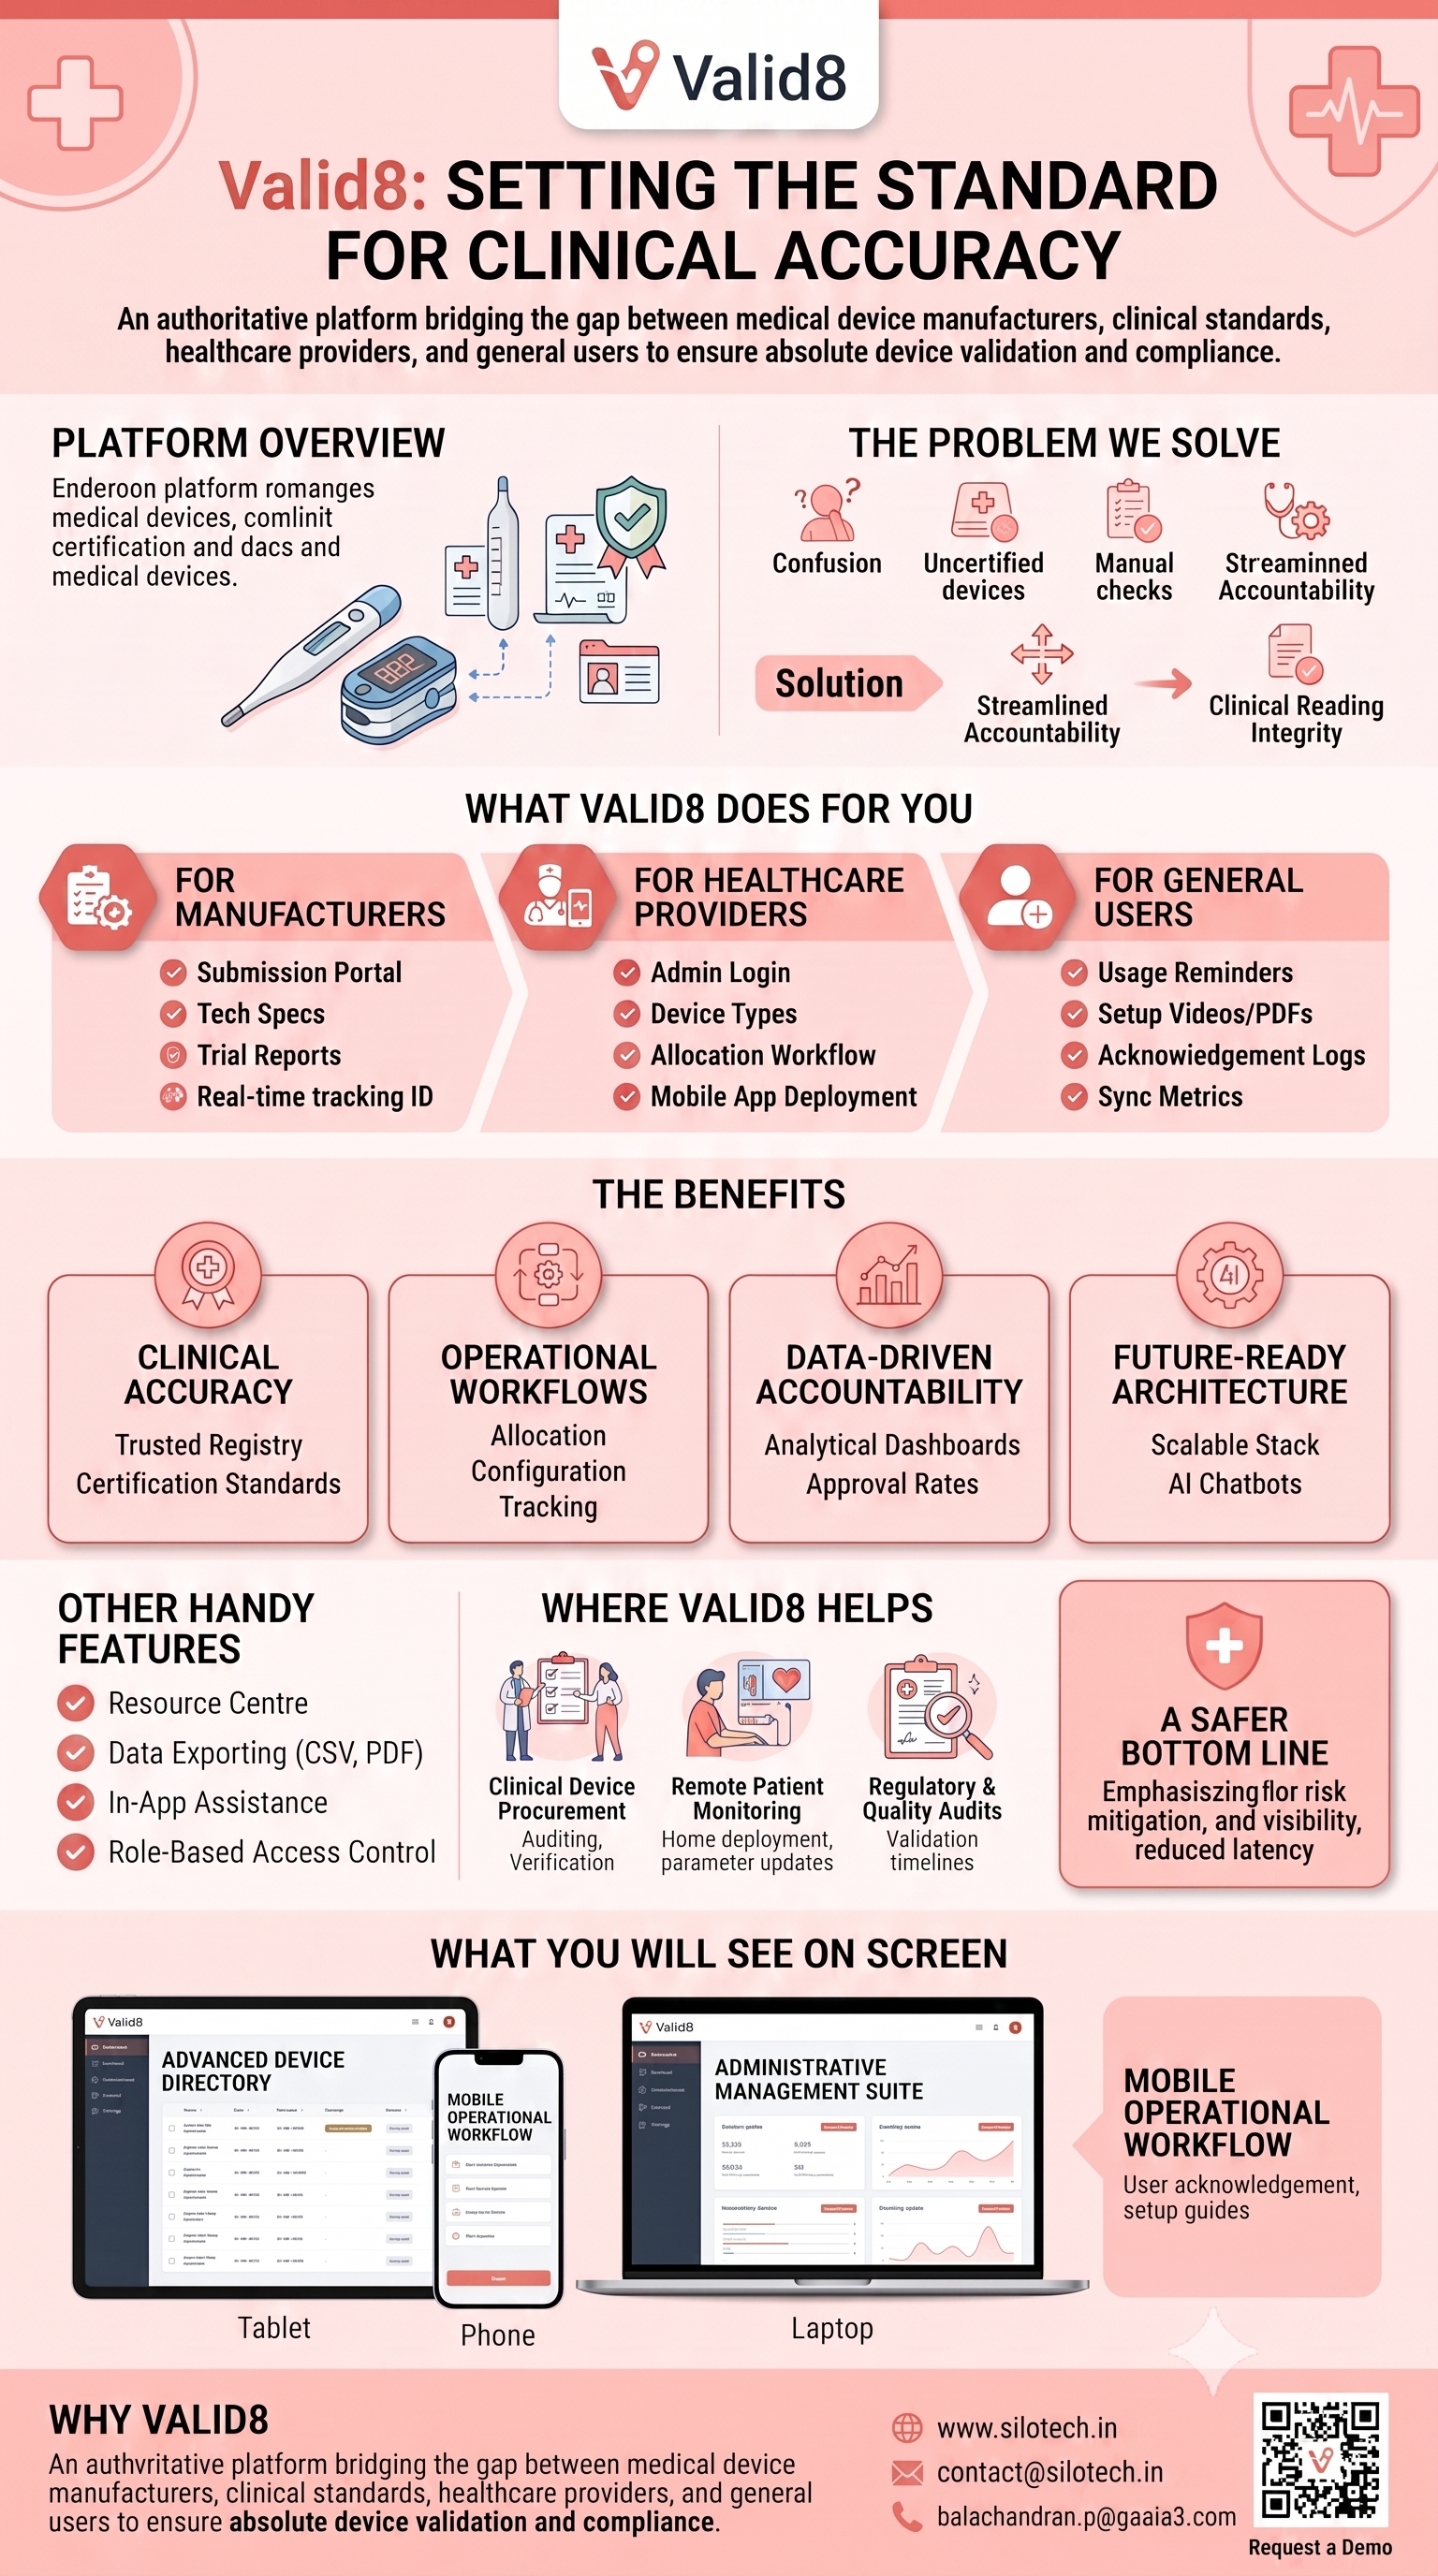
Valid8 — Clinical Device Validation & Compliance

An authoritative platform bridging manufacturers, clinical standards, providers, and users for absolute device validation and compliance.

Click the image to view it full-screen — scroll to zoom

Overview

Valid8 is a secure, dynamic, and mobile-responsive ecosystem designed to manage, verify, and track the validation status of clinical medical devices. It serves as a central hub where manufacturers can submit hardware for validation, administrators can verify clinical standards (such as ISO and AAMI), and general users or healthcare providers can query an authoritative registry of certified devices. The platform combines dynamic front-end search tools, comprehensive resource materials, operational backend workflows, and robust analytical dashboards to simplify device accountability.

The Problem We Solve

The medical device landscape is filled with non-certified or under-tested equipment, leaving healthcare providers, patients, and manufacturers vulnerable to compliance risks and inaccurate clinical readings. Checking validation status manually across multiple standard bodies (ISO, AAMI) is time-consuming and prone to errors. Furthermore, healthcare providers often struggle to allocate the correct, verified devices to end-users and seamlessly track their clinical usage and data transmission back to servers.

What Valid8 Does for You

  • For Manufacturers: Provides a secure submission portal to upload technical specifications, clinical trial reports, and international certificates, while offering real-time tracking IDs to monitor approval status.

  • For Healthcare Providers: Enables administrators to log in, define device types, allocate verified hardware to specific providers, and deploy workflows directly to end-user mobile apps.

  • For General Users: Offers a mobile-optimized experience complete with device usage reminders, setup assistance (via videos, images, and PDFs), and direct acknowledgement logs that sync metrics back to the server.

The Benefits

  • Guaranteed Clinical Accuracy: Fast access to a trusted registry filtered by certification standards and device categories (e.g., BP Monitors, Pulse Oximeters).

  • Streamlined Operational Workflows: Simplifies the allocation, re-allocation, configuration, and eventual de-allocation of medical devices between administrators, providers, and end-users.

  • Data-Driven Accountability: Empowers both administrators and manufacturers with dynamic dashboards detailing approval rates, region-wise interest, active submissions, and device popularity trends.

  • Future-Ready Architecture: Designed on a scalable tech stack (Node.js/Django backend, React/Angular UI, and PostgreSQL/MongoDB) optimized for future AI chatbots, real-time updates, and multi-criteria comparison filters.

Other Handy Features

  • Resource & Knowledge Centre: Access a robust repository of educational articles, guided validation tutorials, case studies, and compliance PDFs.

  • Comprehensive Data Exporting: Allows both administrators and manufacturers to pull weekly/monthly summary trend reports into standard formats like CSV, Excel, and PDF.

  • In-App Assistance: Features context-driven device setup manuals and automated usage reminders directly on the user’s mobile interface.

  • Role-Based Access Control: Protects system integrity with SSL encryption and strict permission levels tailored separately for Admins, Providers, and Manufacturers.

Where Valid8 Helps

  • Clinical Device Procurement: Assists hospitals and healthcare facilities in auditing and verifying the legitimacy of medical tech before purchase.

  • Remote Patient Monitoring (RPM): Facilitates the deployment of physical devices to users at home, verifying proper setup, tracking usage alerts, and ensuring consistent parameter updates back to clinical servers.

  • Regulatory & Quality Audits: Helps medical device manufacturers keep historical compliance records, validation timelines, and feedback loops structured for audit readiness.

A Safer Bottom Line

Valid8 mitigates corporate and clinical risk by preventing the utilization of uncertified hardware, which could lead to misdiagnosis or regulatory penalties. By offering clear visibility into device inventory, automated tracking of approval rates, and concrete analytics on regional device interest, it reduces administrative latency and builds a highly defensible, compliant operational footprint.

What You Will See On Screen

  • Advanced Device Directory: A searchable matrix containing the device name, model number, manufacturer info, validation date, and clickable links to supporting clinical trial documents.

  • Manufacturer Analytics Hub: Graphical insights highlighting current device statuses (Pending, Approved, Rejected), regional engagement heatmaps, and views per device.

  • Administrative Management Suite: Control panels for validating device lists, tracking submission spikes, monitoring website traffic, and updating governing committee structures.

  • Mobile Operational Workflow: A clear, intuitive interface for end-users to acknowledge device utilization, read setup guides, and receive schedule reminders.

Why Valid8

Valid8 is more than just a registry; it is an end-to-end device validation and deployment pipeline. By connecting validation tracking, secure manufacturer uploads, and downstream user allocation into a single encrypted environment, it ensures absolute reliability from the factory floor to the patient’s hands.

Case Study · Med Tech

RMG Booking — Diagnostic Test Booking & Center Management Platform

From app tap to report in hand — diagnostics made simple, for everyone.

Click the image to view it full-screen — scroll to zoom

Overview

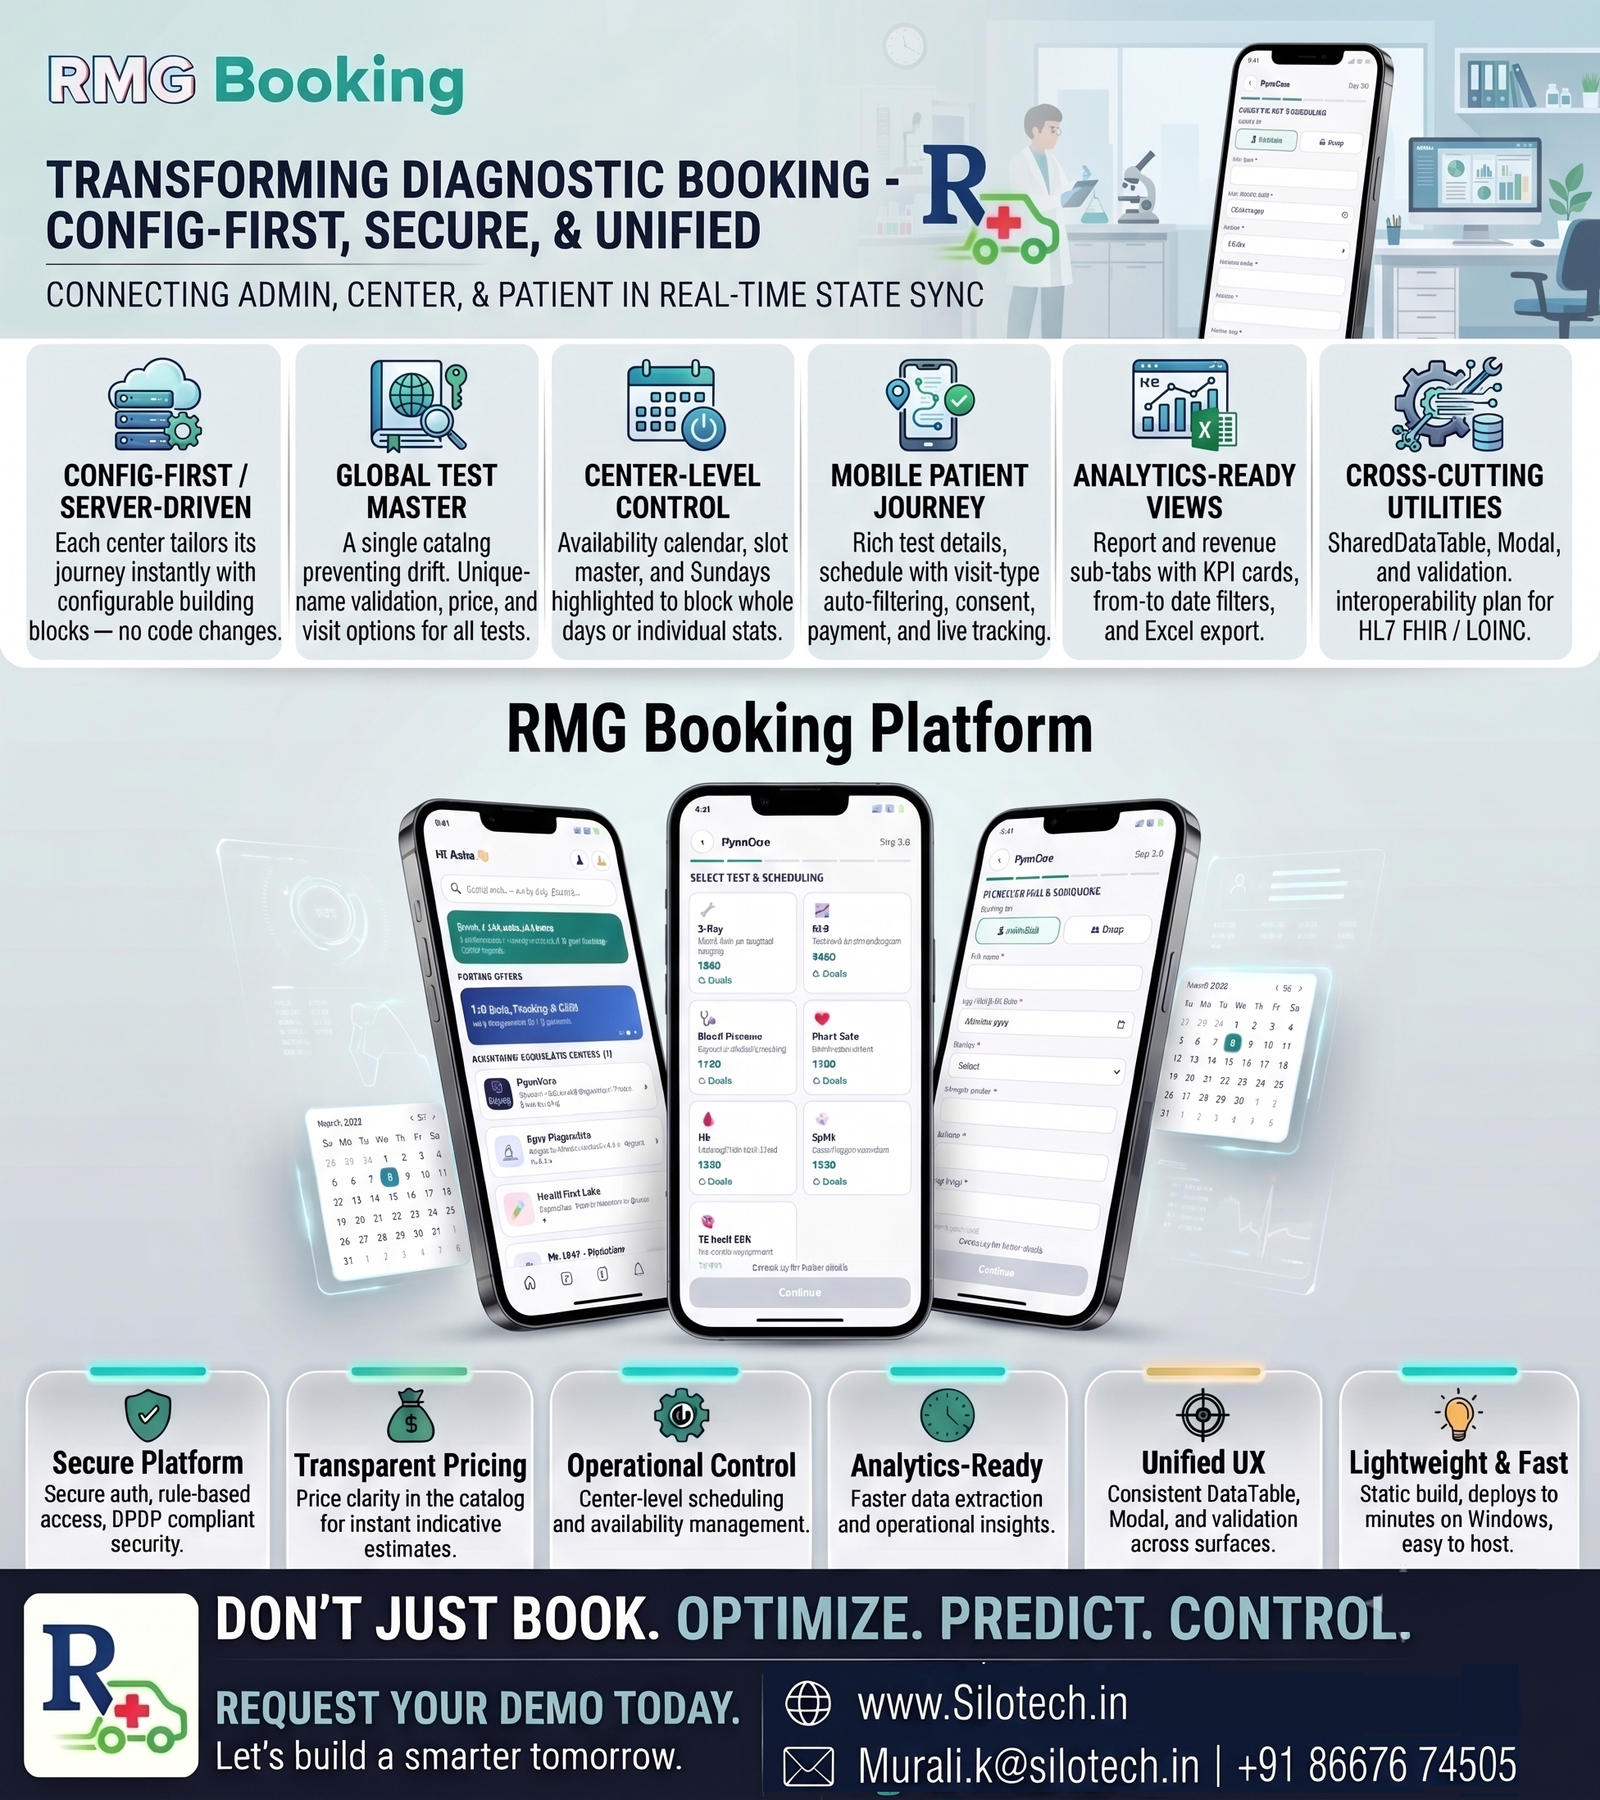
RMG Booking brings the whole diagnostic journey into one simple place — for the patient booking a test, the diagnostic center running the day, and the operator managing the network. Patients book any test from their phone and have the sample collected at home or at the center. Centers see every booking, technician and report in one view. And each center sets up its own booking experience without any software changes.

The Problem We Solve

Booking a diagnostic test is still full of phone calls, paperwork and guesswork — and every center works a little differently. Patients don't know what a test involves or where their report is; centers juggle bookings, slots and reports by hand; operators can't keep the experience consistent. RMG Booking replaces all of that with one clear, live platform that everyone can use.

What RMG Booking Does for You

  • Book any test from your phone — sample collected at home or at the center.
  • Set up each center's booking journey your way — no software changes.
  • Track every booking live, from confirmation to report.
  • Get reports digitally, on any device.
  • Manage all bookings, technicians and reports from one place.
  • Arrange tests, forms, slots and payment options exactly how you want.
  • Use it on a computer, tablet or phone.

Build Your Booking Flow — No Developers Needed

RMG Booking does more than take bookings — it lets each center design its own journey and change it in seconds, so you're never waiting on a software release.

  • Compose the flow from ready-made steps — home page, test selection, patient details, scheduling, consent and payment.
  • Rename labels, add or remove fields, edit slots and choose payment options — changes go live instantly.
  • Every center stays unique — its own look, tests, prices and flow.

Manage Tests, Slots and Availability

  • Keep one master list of tests and categories, reused everywhere — no duplicates.
  • Configure each test fully — icon, description, how it works, what samples are collected, price, home or center visit, plus extra images and documents.
  • Set your available days and time slots, and block a whole day or a single slot with a note when needed.

The Benefits

  • Faster, simpler bookings and happier patients.
  • Fewer phone calls and less paperwork for centers.
  • One consistent experience across every center.
  • Better data quality, thanks to built-in checks on every form.
  • A clear view of reports and revenue.
  • Quick to launch and easy to run.
  • Safe, secure and easy for anyone to use.

Other Handy Features

  • A live tracking timeline — from booking to sample to report.
  • Instant notifications for patients and centers.
  • Simple reports and revenue views you can filter by date, view or download to Excel.
  • Search, sort and page through any list, and export in one click.
  • Offers and banners to promote tests and packages.
  • Individual and group bookings in the same flow.
  • Your own dashboard — the numbers you care about, at a glance.

Where RMG Booking Helps

  • Diagnostic Labs & Pathology — a full test catalog with home collection and instant digital reports.
  • Imaging & Radiology Centers — X-ray and scan bookings with center-only visits and clear prep instructions.
  • Multi-branch Chains — one platform where every branch keeps its own flow, slots and pricing.
  • Hospitals & Clinics — patient details, referrals, consent and report delivery in a single journey.
  • Home Sample Collection — schedule technicians, track each visit, and deliver reports on time.
  • Corporate & Group Health Camps — group bookings that capture everyone under one appointment.
  • Wellness & Preventive Health — packages, offers and easy rebooking that keep patients coming back.

A Clearer Bottom Line

Every booking is captured, tracked and turned into a report — and into revenue you can see. RMG Booking adds it up for you in plain numbers, by day and by report, for today and for the month, so you always know how the business is doing.

What You Will See On Screen

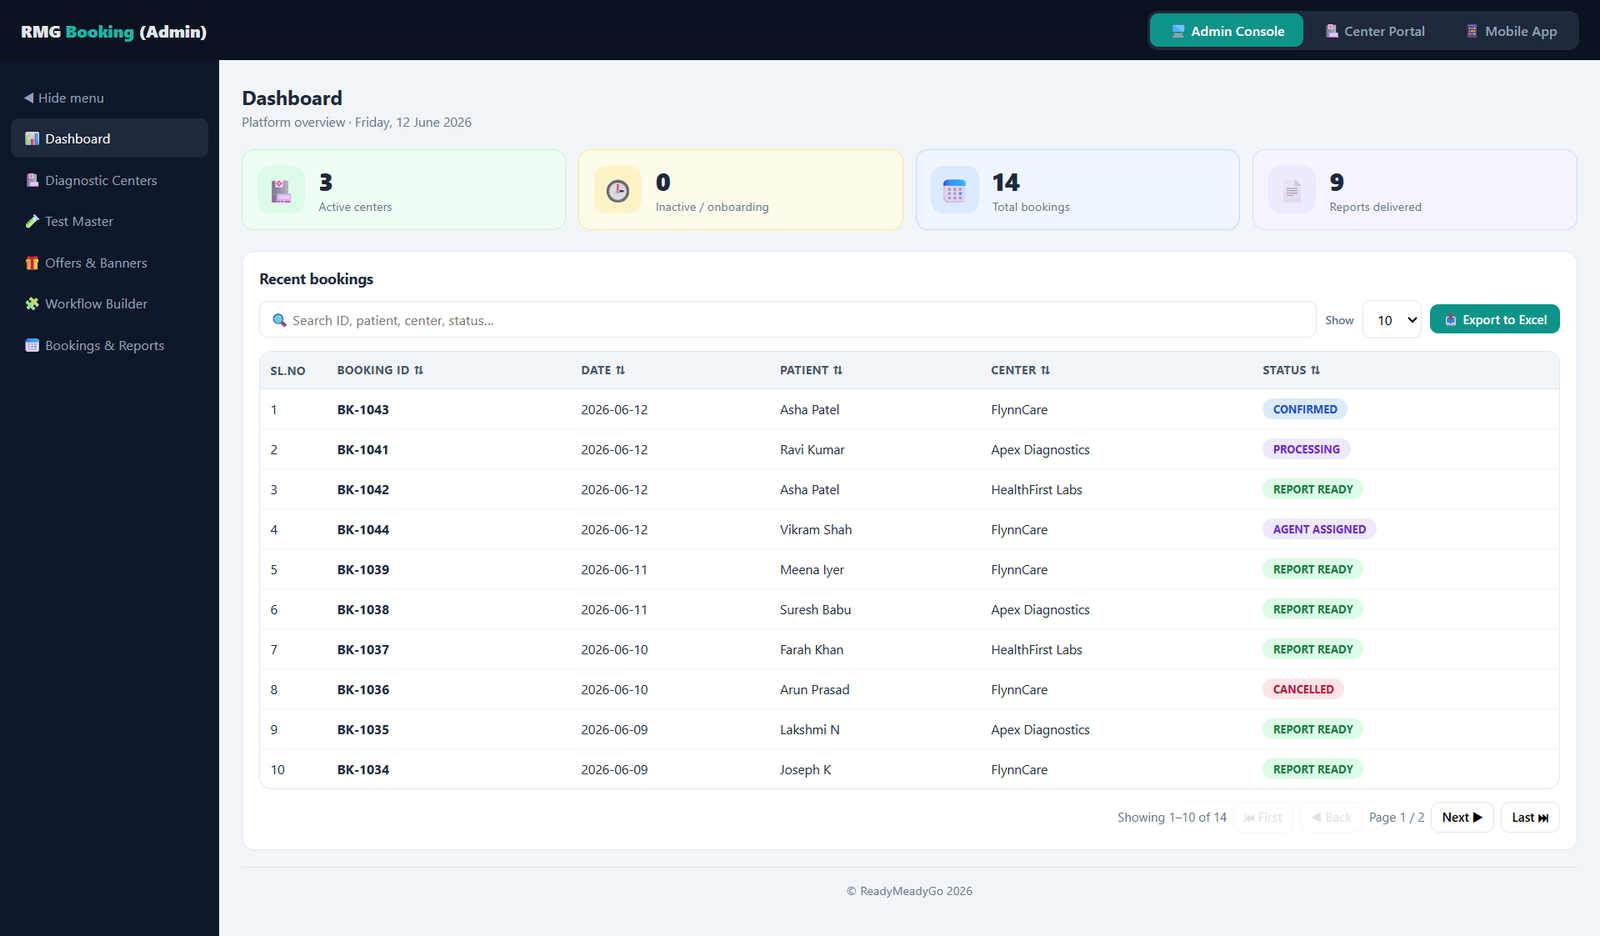
Admin Console — your whole network at a glance

RMG admin console
  • KPI cards for active centers, total bookings and reports delivered, with a recent-bookings table.
  • Center onboarding and verification, a global Test Master, offers and banners, and a live Workflow Builder that updates every app instantly.

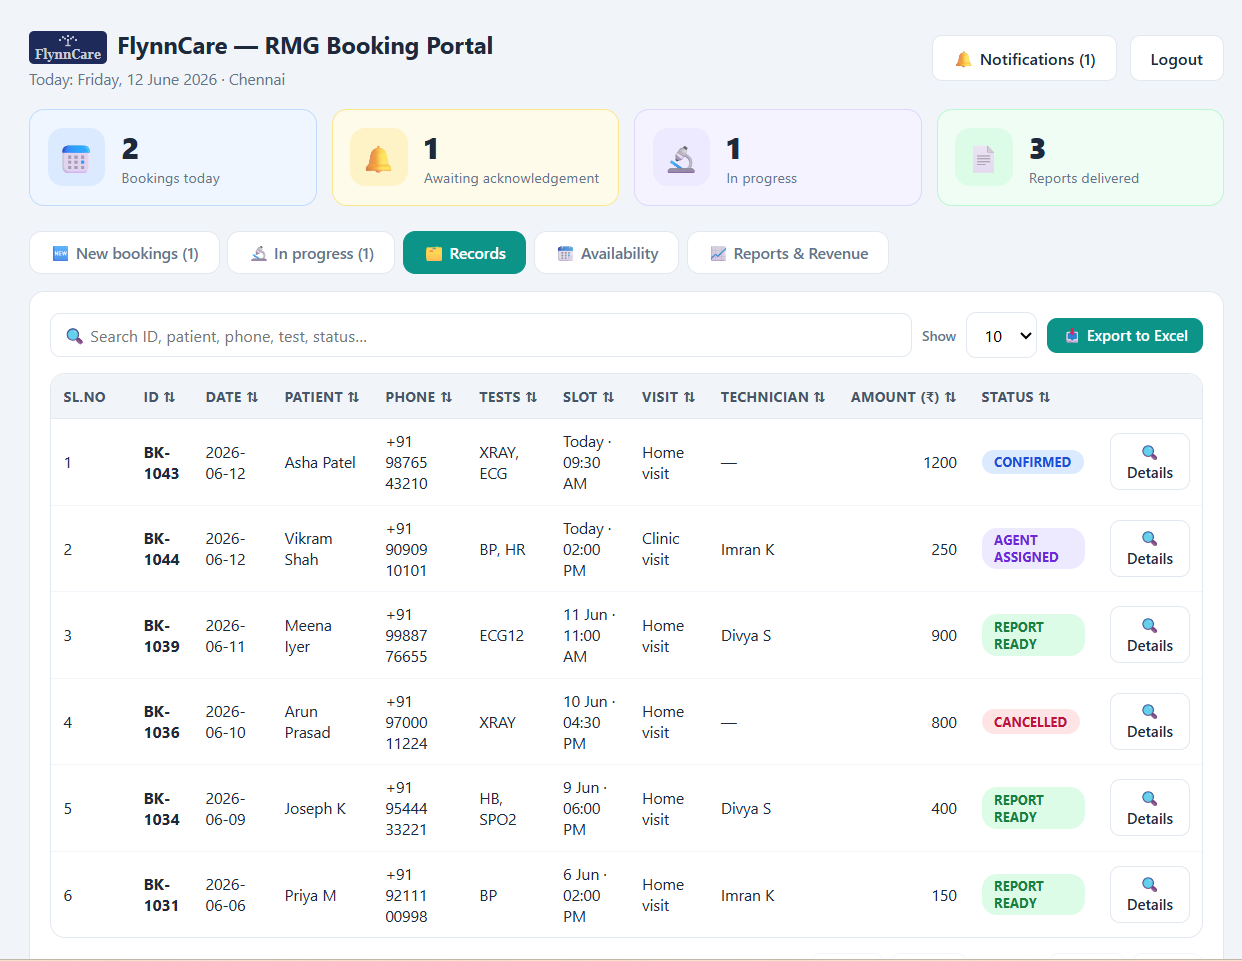
Center Portal — one center’s day, in one place

RMG center portal
  • KPI cards, new bookings to acknowledge and assign, and in-progress jobs ready for report upload.
  • An availability calendar to block days or slots, a Slot Master for time slots, and a Reports & Revenue view with date filters.

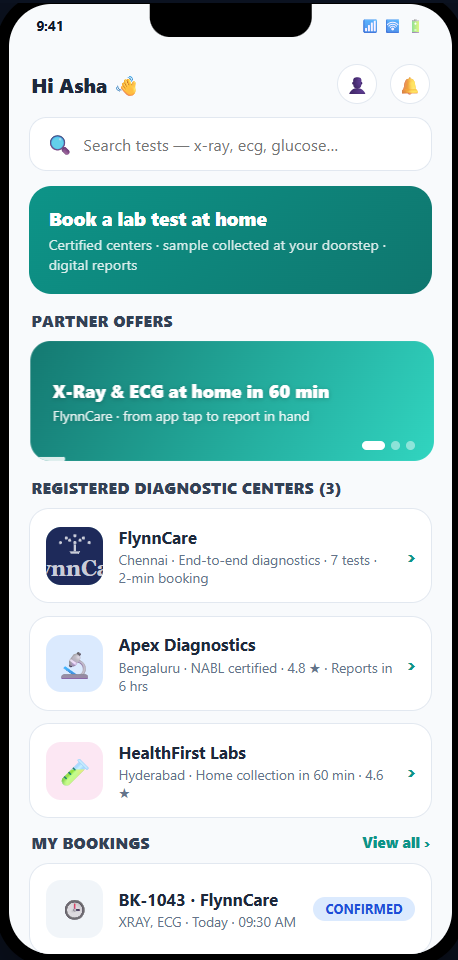
Mobile App — the patient’s view

RMG mobile app
  • Search and browse registered centers and tests, with offers and full test details.
  • Book step by step, track the visit live, and view or download the final report.

Why RMG Booking

Diagnostics should be as easy as tapping your phone — and running a center should be just as simple. RMG Booking gives patients a clear, guided booking and a report they can trust, and gives centers one place to run every booking, slot and report. Faster bookings, less paperwork, a consistent experience across every center, and a clear view of reports and revenue — all from one simple, secure platform.
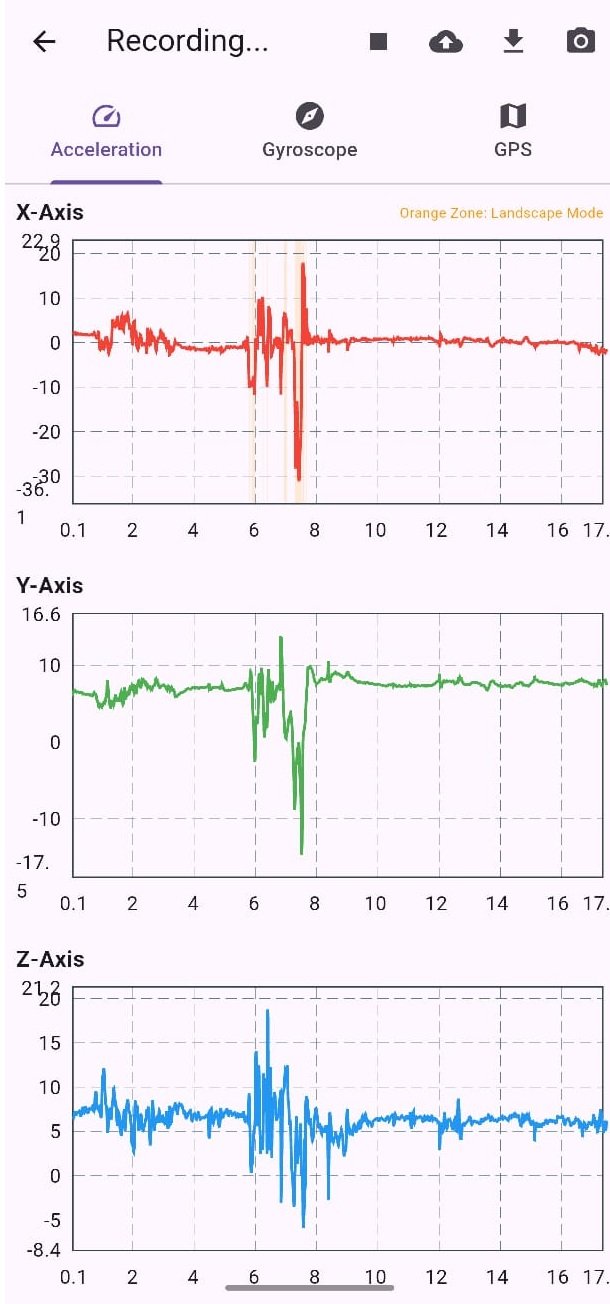
Case Study · Med Tech

e-HAP — Hassle Free Health Access

Revolutionizing preventive healthcare access — 60+ health parameters, anywhere, anytime.
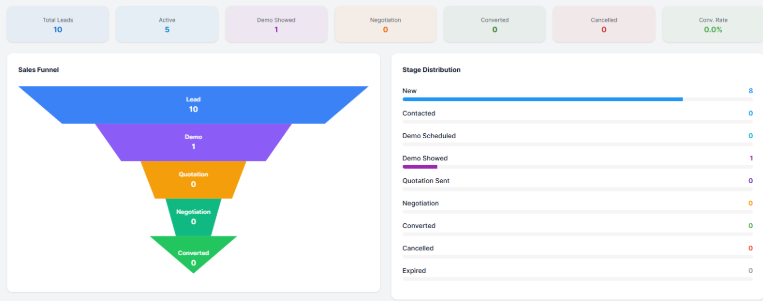
Click the image to view it full-screen — scroll to zoom

Overview

e-HAP (Hassle-Free Health Access) is an all-in-one health kiosk and smart remote diagnostic ecosystem designed to empower individuals with instant, point-of-care health checkups. By combining advanced health screening kiosks, mobile diagnostic tools, tele-consultation, and AI-driven insights, e-HAP delivers comprehensive medical metrics anywhere, anytime.

The Problem We Solve

Accessing timely preventive health screenings often involves long wait times, multiple diagnostic lab visits, and fragmented medical records. These friction points prevent individuals from early detection of chronic conditions and infectious diseases. e-HAP eliminates these barriers by bringing multi-parameter diagnostics and instant smart reports into a single, accessible physical and digital touchpoint.

What e-HAP Does for You

  • Comprehensive Health Screening: Tests and tracks over 60+ health parameters on demand.

  • Smart Medical Reporting: Instantly delivers diagnostic reports directly to your Email or WhatsApp for immediate sharing.

  • Connected Care: Bridges users with diagnostic associates, technology partners, and remote healthcare professionals through integrated tele-consultation services.

The Benefits

  • Instant & Point-of-Care Insights: Offers rapid, high-accuracy results for non-invasive and rapid diagnostic tests directly at the point of care.

  • AI-Powered Personalization: Generates automated, personalized AI-powered meal plans and lifestyle recommendations based on screening metrics.

  • Seamless Medical Mobility: Grants instant access to historical health metrics using a personalized QR-based Health Card.

  • Advanced Remote Diagnostics: Covers a broad diagnostic spectrum, including cardiac, pulmonary, metabolic, infectious disease, urine, vision, ear, and general health evaluations.

Other Handy Features

  • Instant ECG: Real-time 6-Lead or 12-Lead ECG recording for immediate cardiac risk assessment.

  • Digital Auscultation & Visualization: Includes digital stethoscope assessment (chest/lung/cardiac sounds) and otoscope visualization for ear evaluations.

  • Rapid Test Support: Rapid testing integration for infectious diseases (e.g., Dengue, Covid Antigen, Typhoid, Malaria, Chikungunya, Hepatitis B/C).

  • Secure Medical Record Maintenance: Centralized, encrypted storage of health reports to ensure patient privacy and easy longitudinal tracking.

Where e-HAP Helps

  • Corporate Wellness Hubs: On-site preventive health checkups for employees to boost health awareness and productivity.

  • Community & Rural Healthcare Clinics: Extending diagnostic reach to underserved regions with lightweight, point-of-care equipment.

  • Pharmacies & Retail Diagnostic Outlets: Enhancing patient foot traffic by offering walk-in health screenings and rapid consultations.

  • Remote Patient Monitoring & Public Workspaces: Easy-to-use kiosks placed in high-footfall areas for ongoing health monitoring.

A Safer Bottom Line

e-HAP reduces overall healthcare expenditure by shifting the focus from expensive reactive treatments to early, proactive detection. For organizations and healthcare providers, it lowers diagnostic overhead, optimizes patient intake workflows, and provides data-driven analytics to manage wellness programs efficiently.

Why e-HAP

e-HAP combines cutting-edge AI software, robust diagnostic hardware, and seamless mobile accessibility. It is a complete end-to-end preventive health platform that makes quality healthcare accessible, affordable, and hassle-free for everyone.